Purpose of glide testing
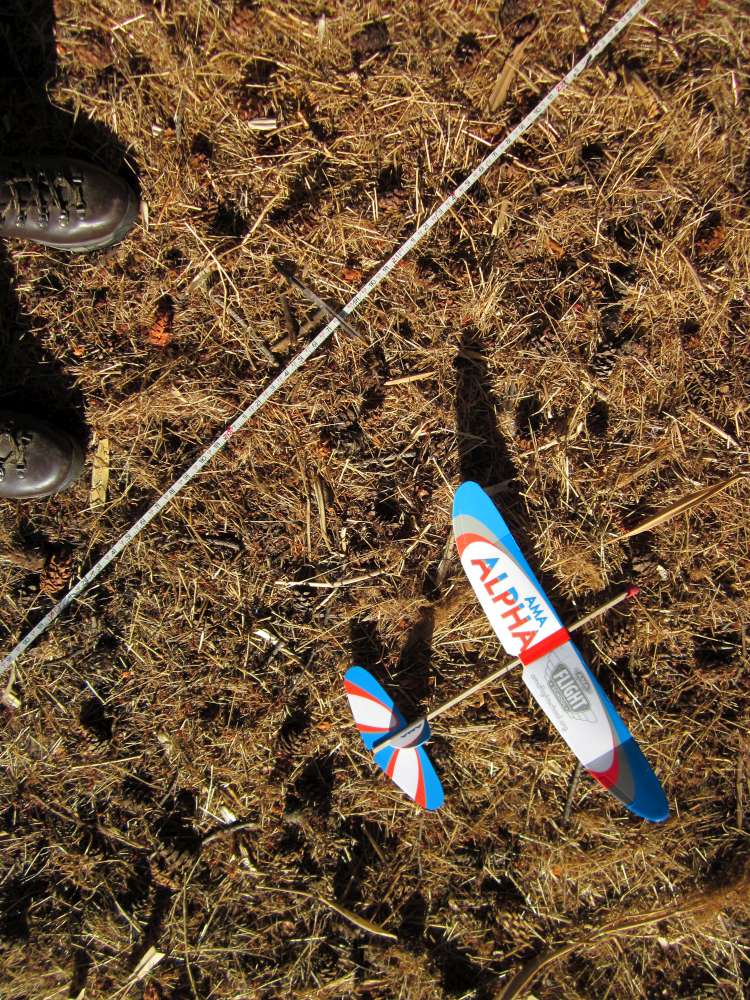
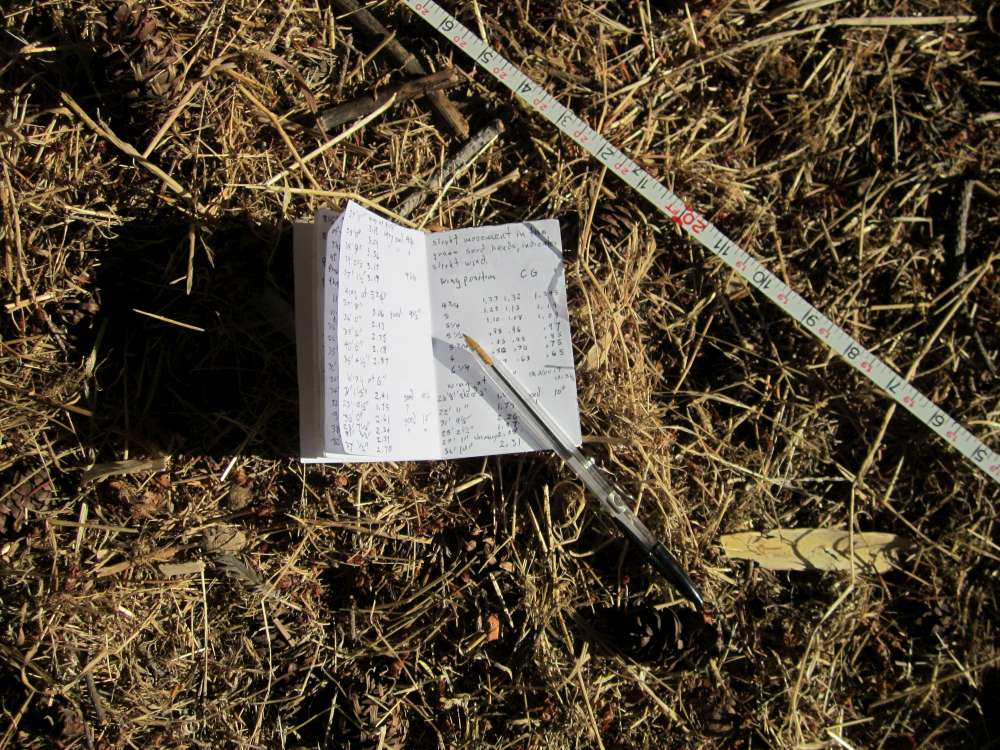
Making the glides and measurements
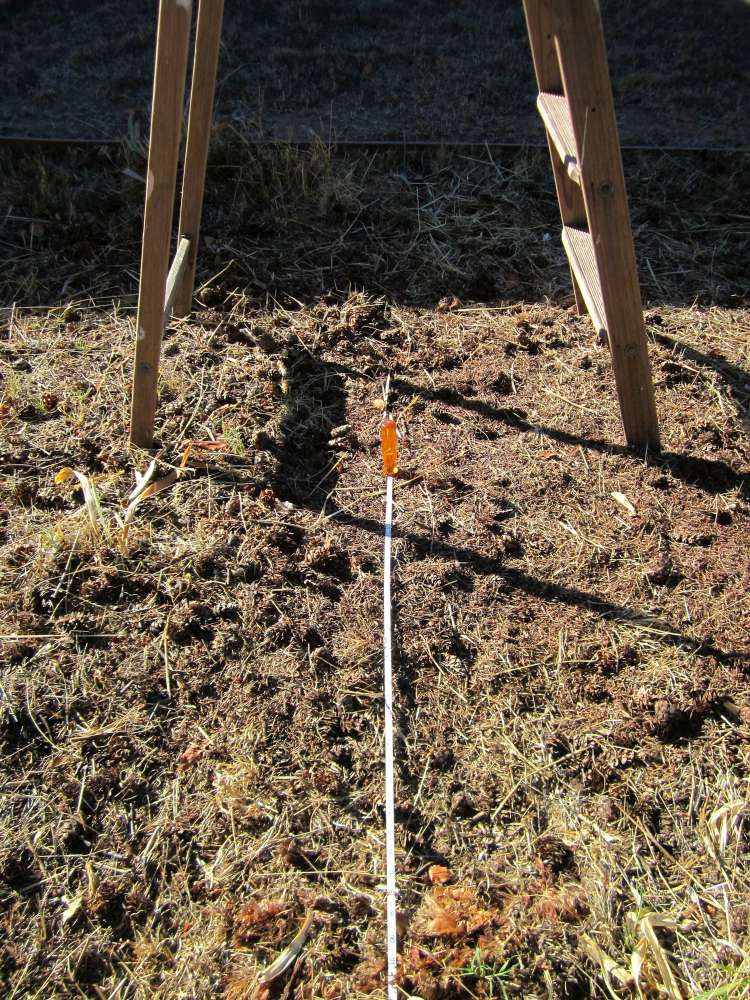
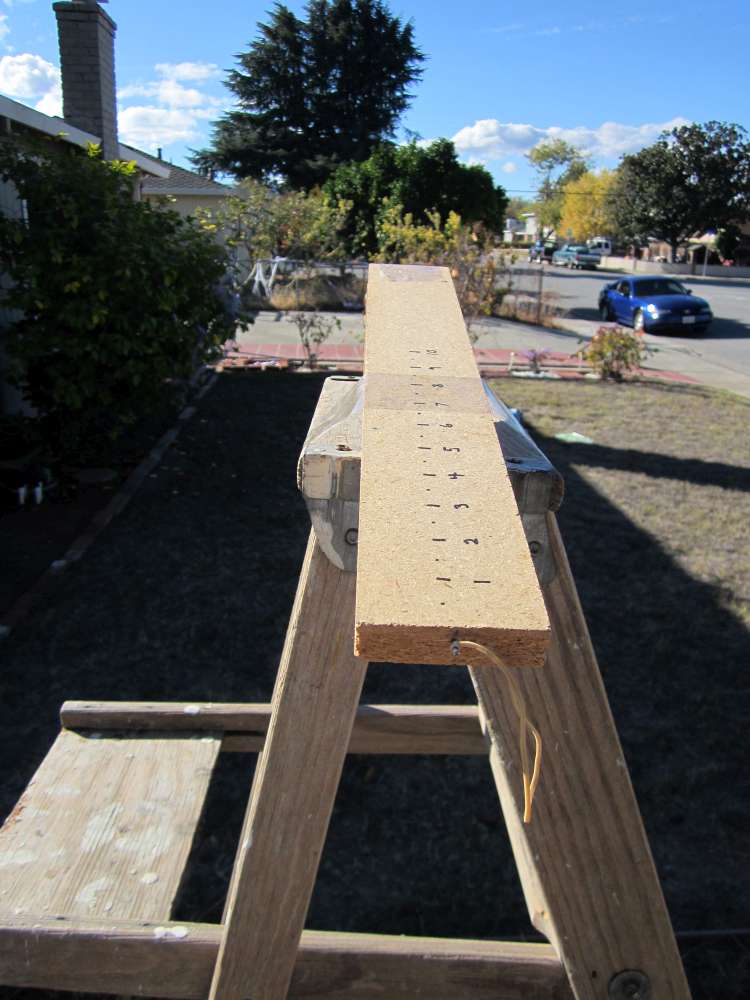
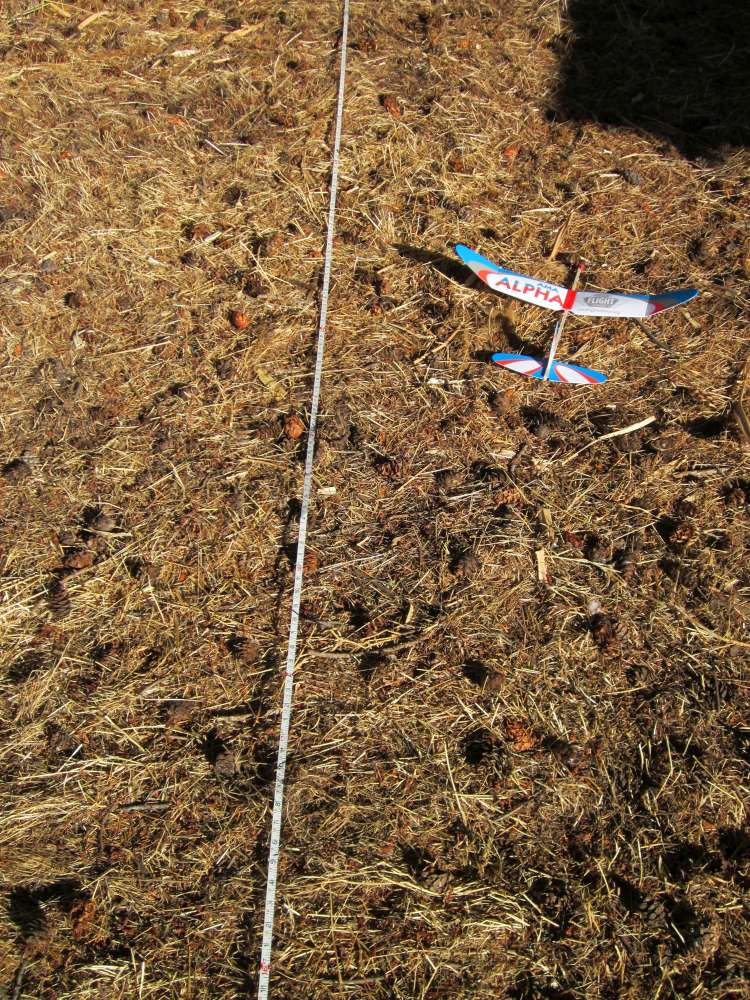
Ideally glide testing is done over a smooth, flat, horizontal floor in the absence of any air movement. We don’t always have access to the ideal environment. I made these flights across my front yard, at night, because that was the only time there was no wind. This is how I did it, maybe you will have a better place for your tests.

Enter data into spreadsheets
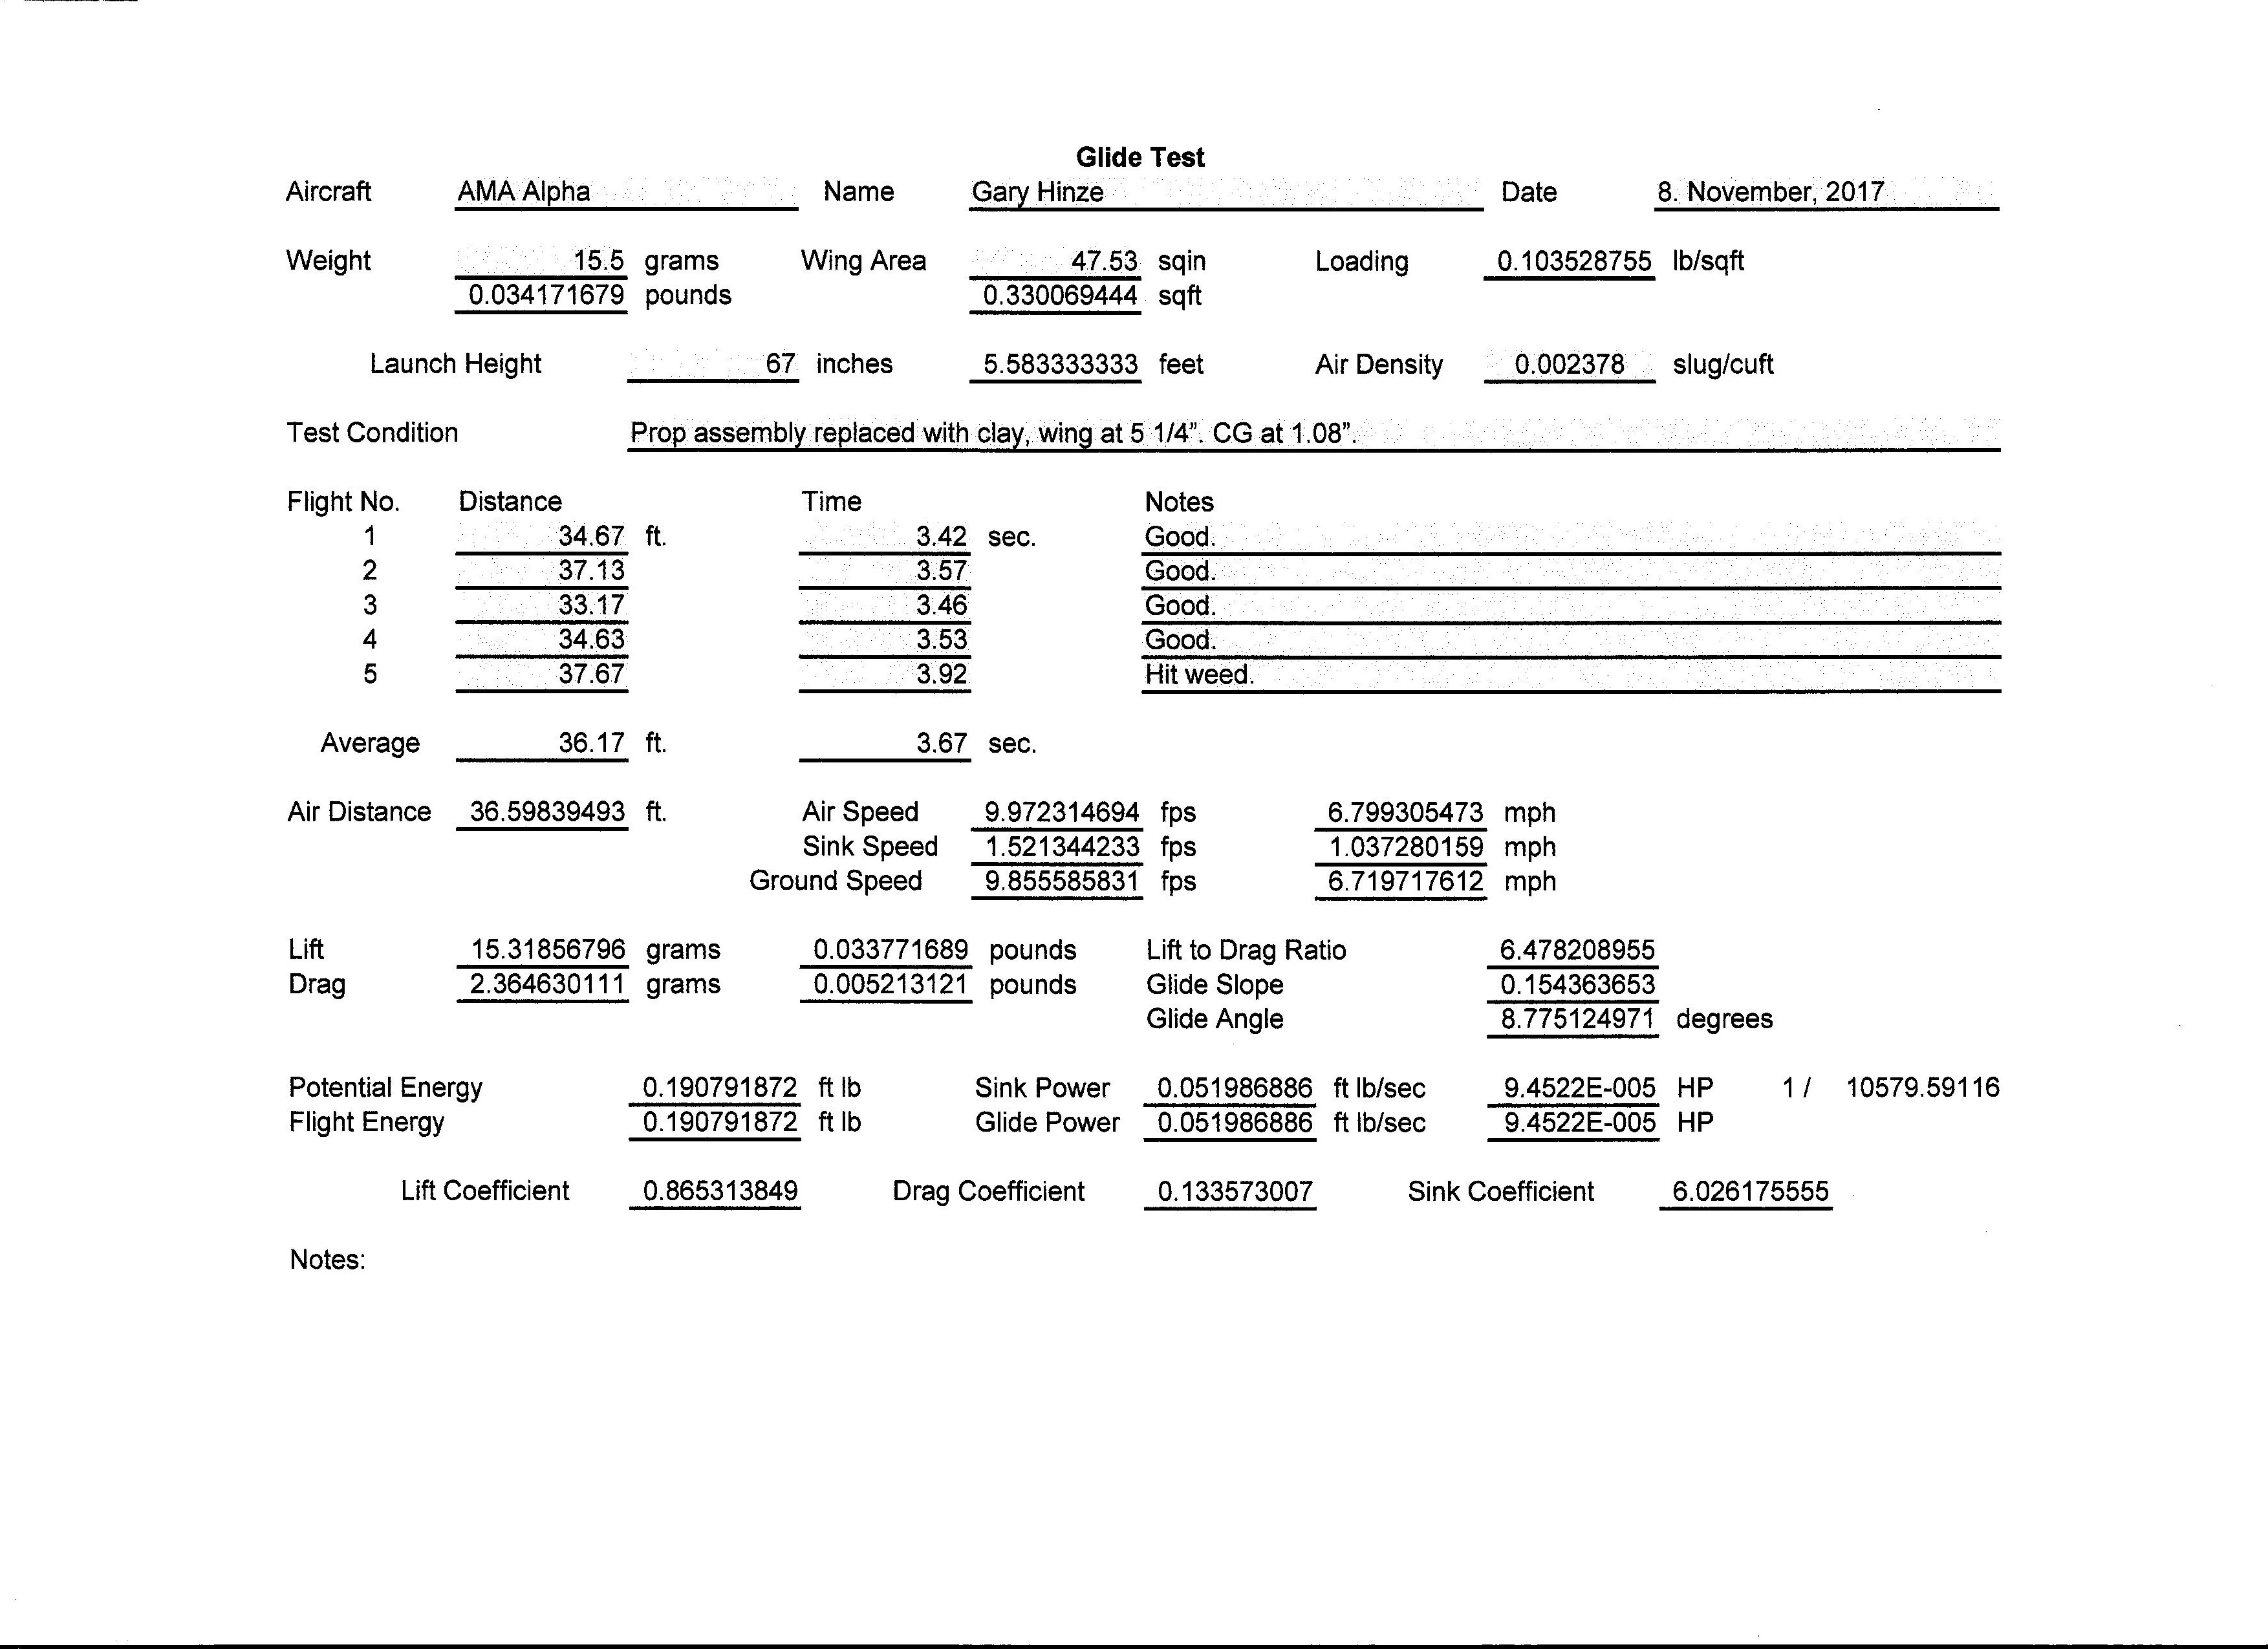
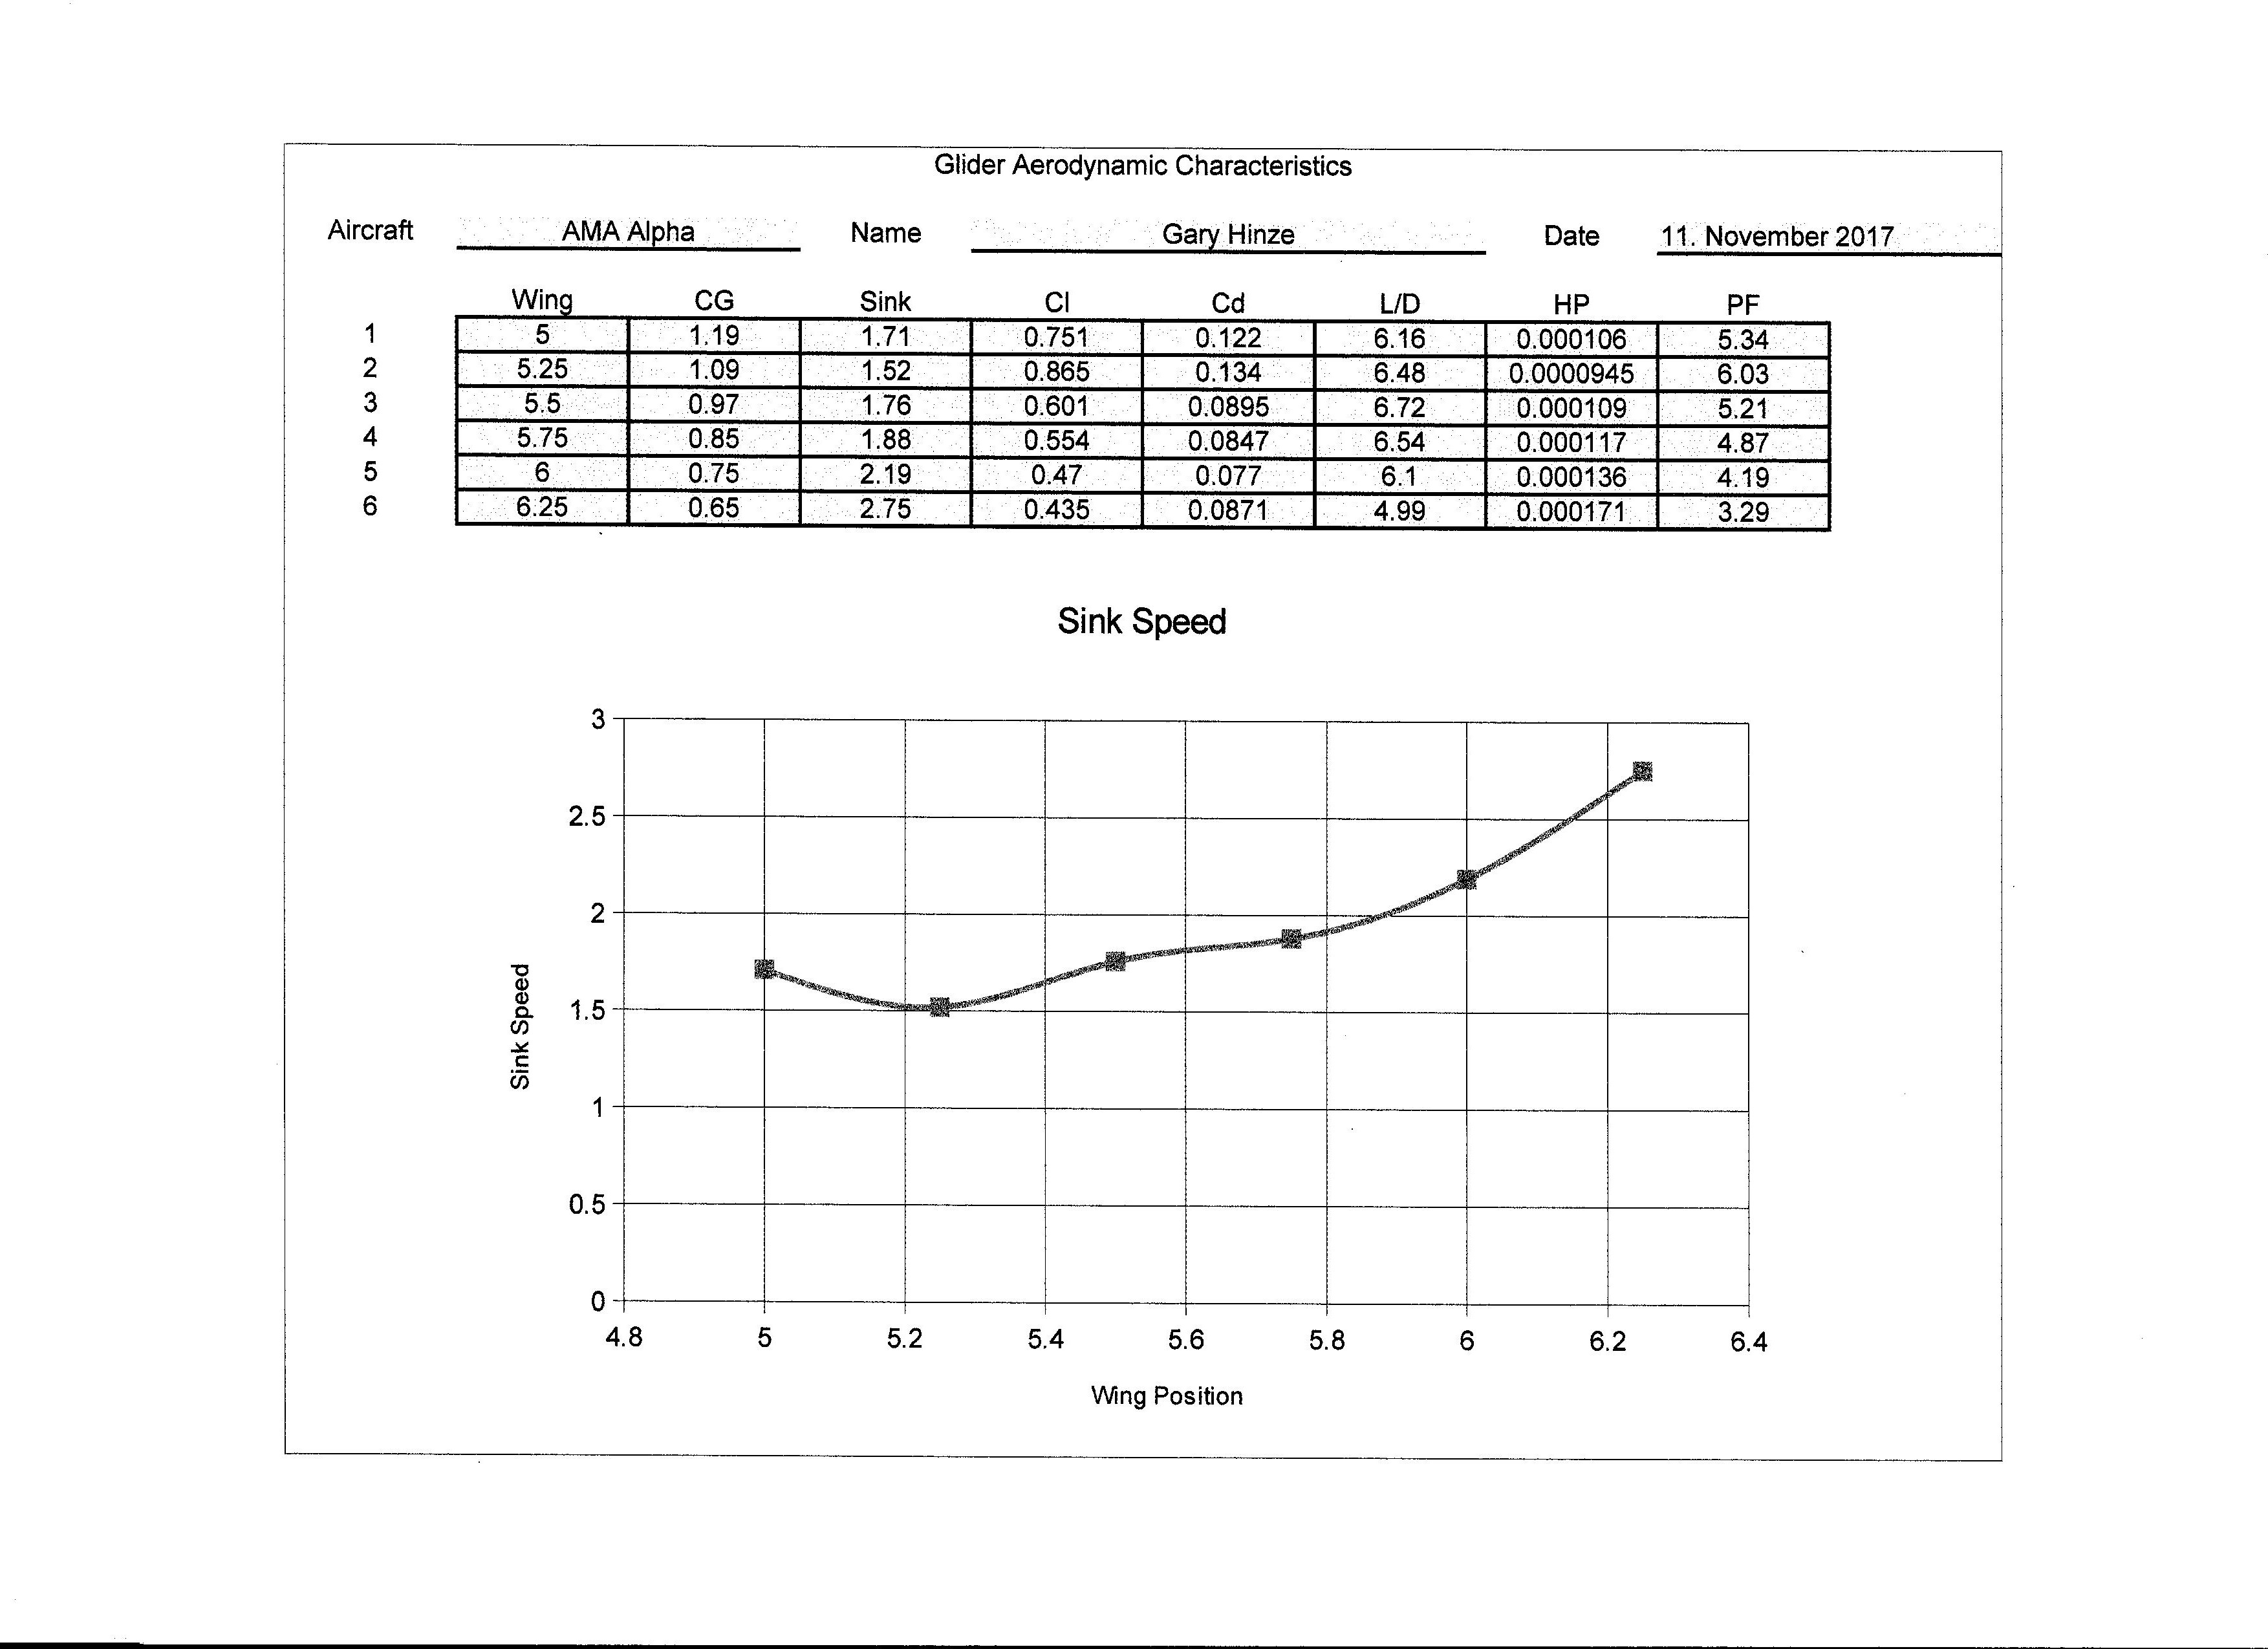
This is a copy of a B&W printout. The original spreadsheet has some data boxes highlighted in yellow. Those are the numbers that you enter into the spreadsheet. The other numbers will be generated by the spreadsheet.
Enter the aircraft name, your name and the date in the top line.
Enter the aircraft weight in grams. The spreadsheet converts it into pounds. Enter the wing area in square inches. The spreadsheet converts it to square feet. It also calculates the wing loading in pounds per square foot.
Enter the height of the launch above ground in inches. The spreadsheet converts it into feet.
Enter the air density in slugs per cubic foot. The value 0.002378 is the standard atmosphere at sea level. Air density varies with pressure, temperature and humidity. Air pressure varies with weather but also with altitude. Look up the air density where you are doing your flight testing.
Record the test condition. If you are exploring the effect of wing position, record the wing position. If you are measuring the effect of a freewheeling propeller, note that. Note the location of the center of gravity. The post on Locating the Center of Gravity tells you how to do that.
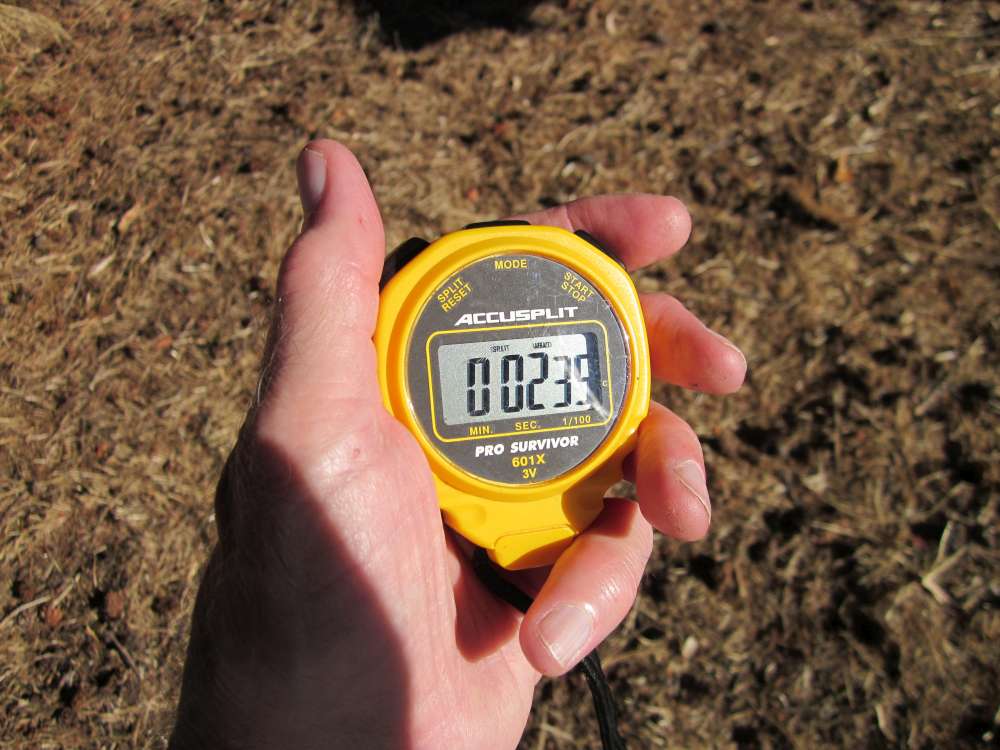
Enter the horizontal distance flown and the time of flight. Record any noteworthy features about the flight. Fill in all five sets of data, don’t leave any blanks. If you leave any blanks, that will affect the averages.
The spreadsheet calculates the averages of the distances and times entered. Those values are used for the following calculations.
The spreadsheet calculates the distance flown through the air in feet, the air speed in feet per second and miles per hour, the sink speed in feet per second and miles per hour and the ground speed in feet per second and miles per hour.
The spreadsheet calculates the lift in grams and pounds, the drag in grams and pounds, the lift to drag ratio, the glide slope and the glide angle.
It calculates the gravitational potential energy at the beginning of the flight and the energy expended going through the air in foot pounds. (They should be the same.) It calculates the power developed as the weight pulls the plane to the ground and the power consumed by the glide through the air. (They should be the same.) Power is given in foot pounds per second and horsepower. To the right, the horsepower is expressed as a fraction. In this case, the Alpha absorbed 1/10,579 horsepower while gliding.
It calculates lift coefficient, drag coefficient and sink coefficient. The significance of these aerodynamic characteristics is explained in the Simple Glider Curriculum referenced above.
There is a place at the bottom of the page for any notes you may wish to record.
You will be making several of these spreadsheets for a set of test conditions for any study you make. You will likely be plotting graphs of the results. You may want to save the spreadsheet with a different file name for each test. You may prefer to print out a copy of each test.
This spreadsheet is in Open Office format. You can download Open Office HERE. You might be able to open the spreadsheet and convert it from your own spreadsheet software.
Click on this Glide Test link to open the spreadsheet. Save it to your computer in a file folder with an appropriate name so you can find it again.
We will fly the plane with six different wing positions. We could use the data from these sheets immediately, picking the CG position that produces the minimum sink. I have prepared another spreadsheet that graphs the results. This gives a good visual of the relationships. The sink speed graph is the one of immediate usefulness.
This spreadsheet is in Open Office format. You can download Open Office HERE. You might be able to open the spreadsheet and convert it from your own spreadsheet software.
Click on this Aerodynamic Characteristics link to open the spreadsheet. Save it to your computer in a file folder with an appropriate name so you can find it again.
Using glide test data to set wing position
Now we know the wing position and the CG location on the wing which correspond to the lowest sink speed of our aircraft. How do we apply this information to the powered version of our airplane? The clay and catapult hook will be removed, a propeller and motor will be put on. That will shift the position of the fuselage CG and require adjustment of the wing position to accommodate the different weight distribution.
Perhaps the most direct approach would be to simply put the airplane together and gradually slide the wing along the stick, checking CG location until it is where we want it.
We can also calculate the wing position that will get the CG where we want it. But before we do that, there are some measurements that must be made.
We must weigh the entire fuselage assembly, including the rubber motor. We must weigh the wing assembly.
The fuselage assembly weighed 8.5 grams. The wing assembly weighed 8.6 grams.
We must find the CG of the fuselage assembly and of the wing.
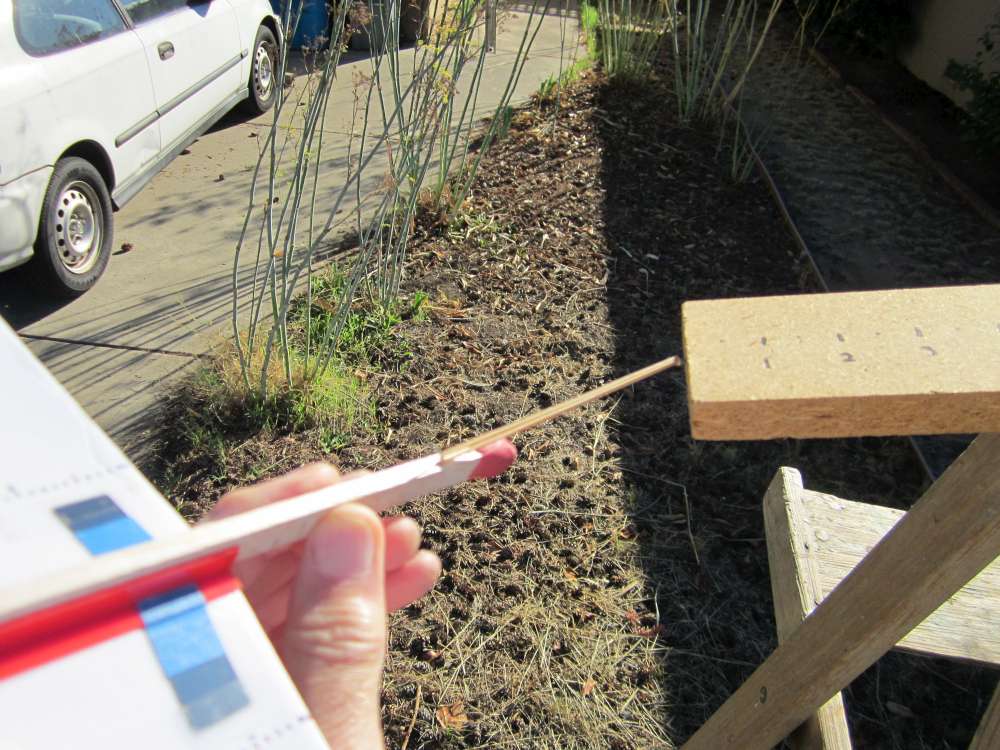
You can start by getting a rough idea where the fuselage CG is by balancing it on your finger. This is a good start, but it isn’t precise enough for our purpose. Our glide data shows how much difference a quarter inch can make.
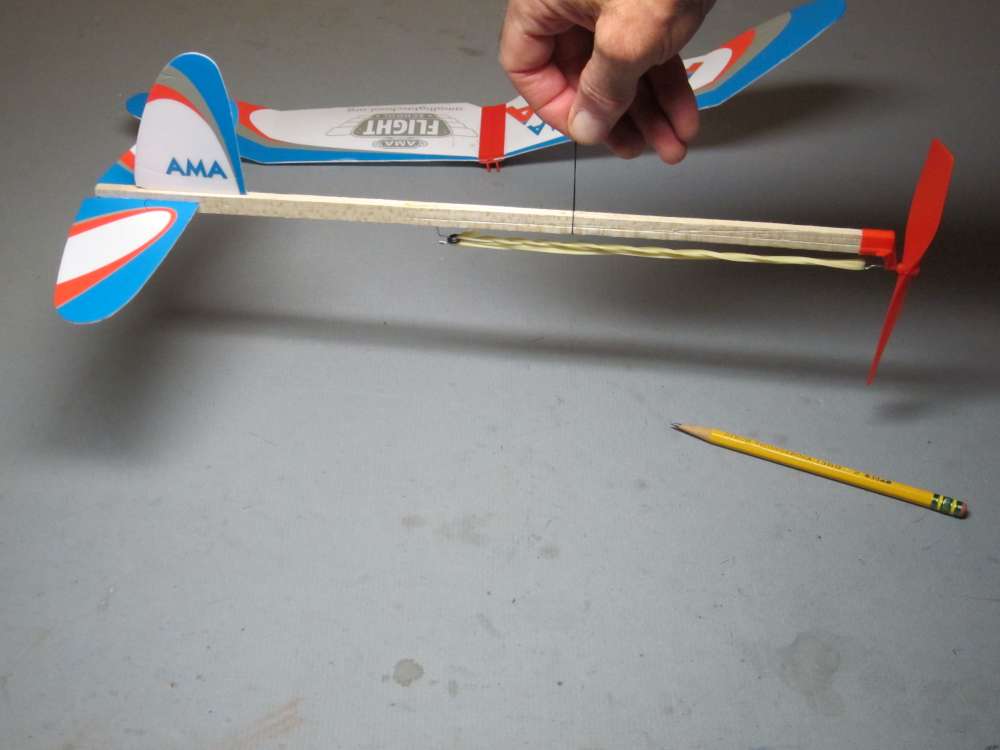
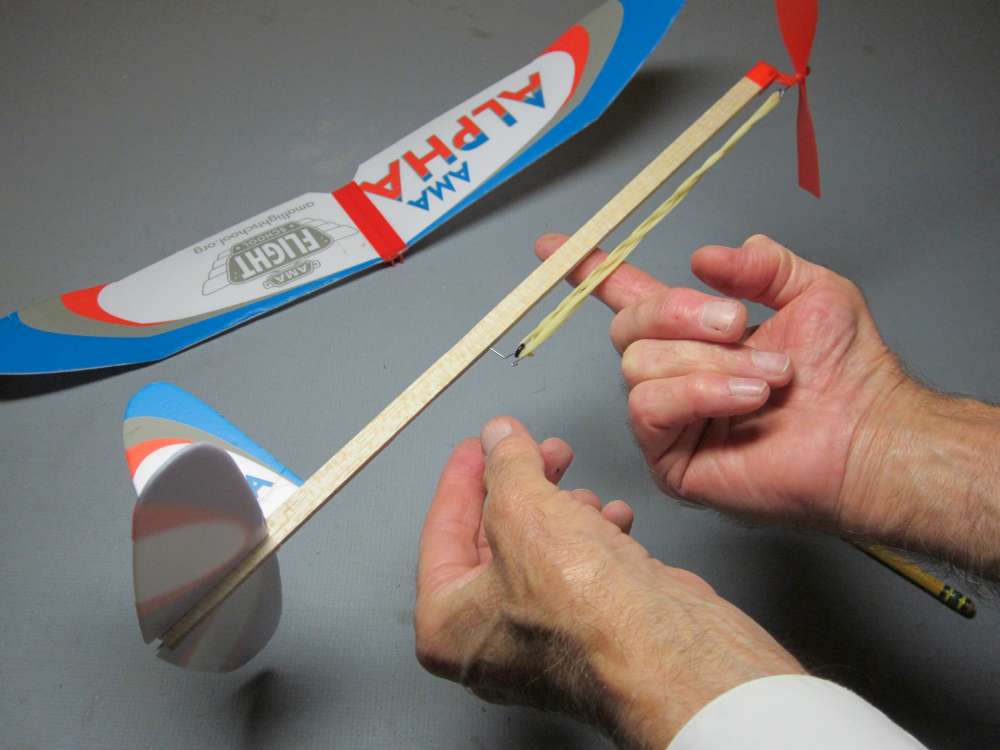
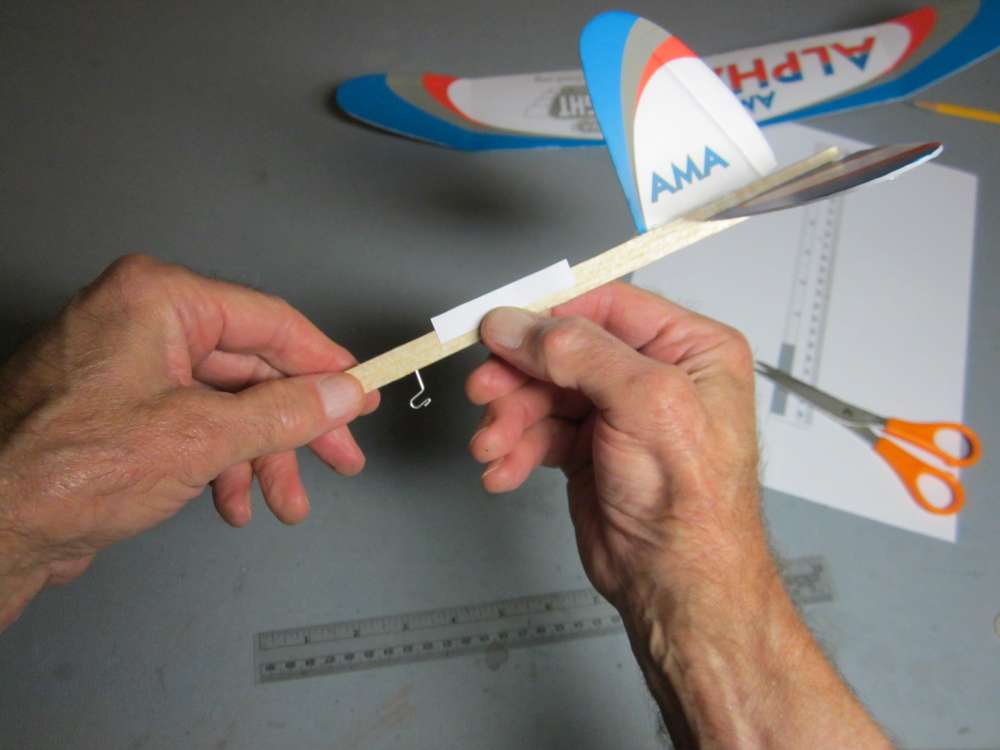
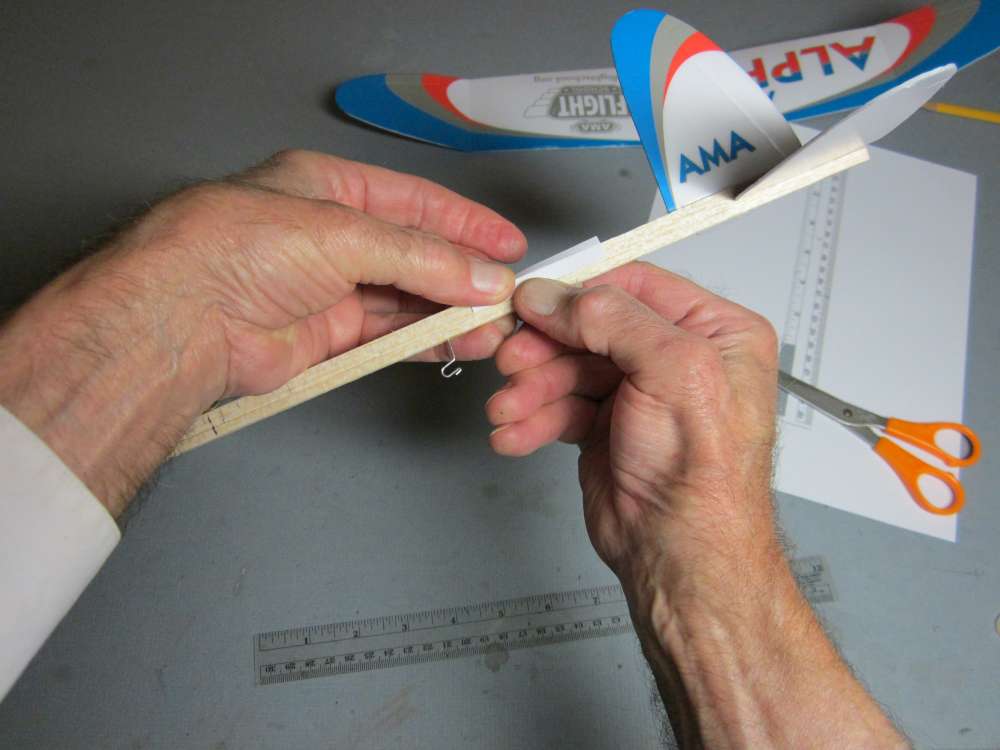
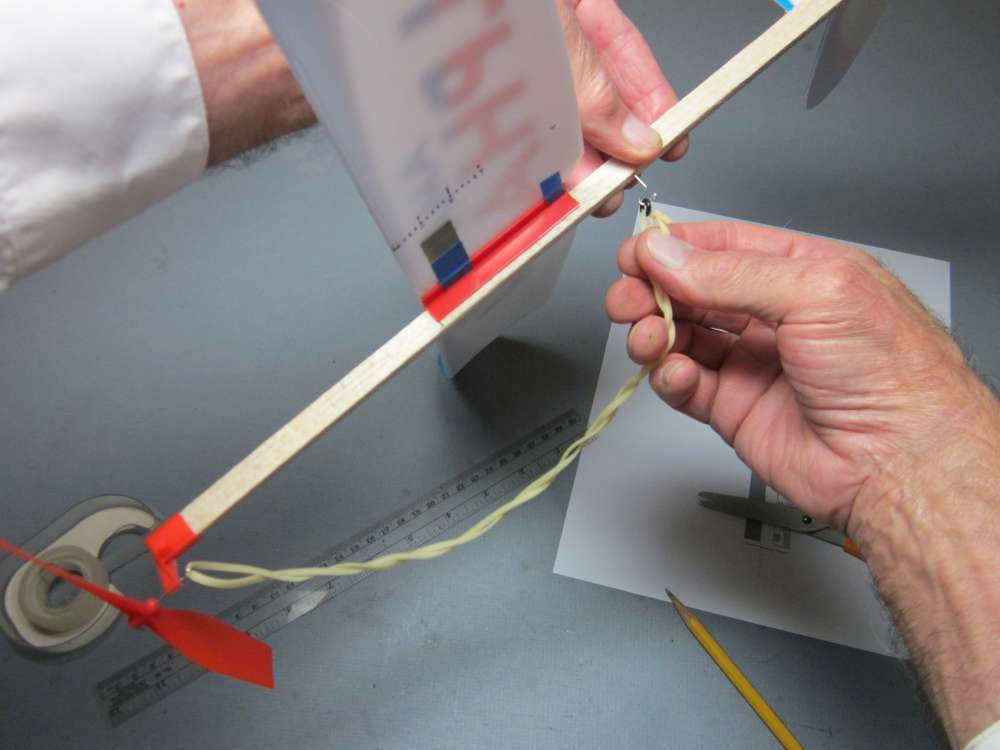
A more precise determination is made by suspending the fuselage from a loop of thread and adjusting its position until it hangs horizontally.
Hold the thread around the fuselage and mark the location.
The mark is extended all the way across the stick, so it will be visible below the wing clip when the wing is put on the stick.
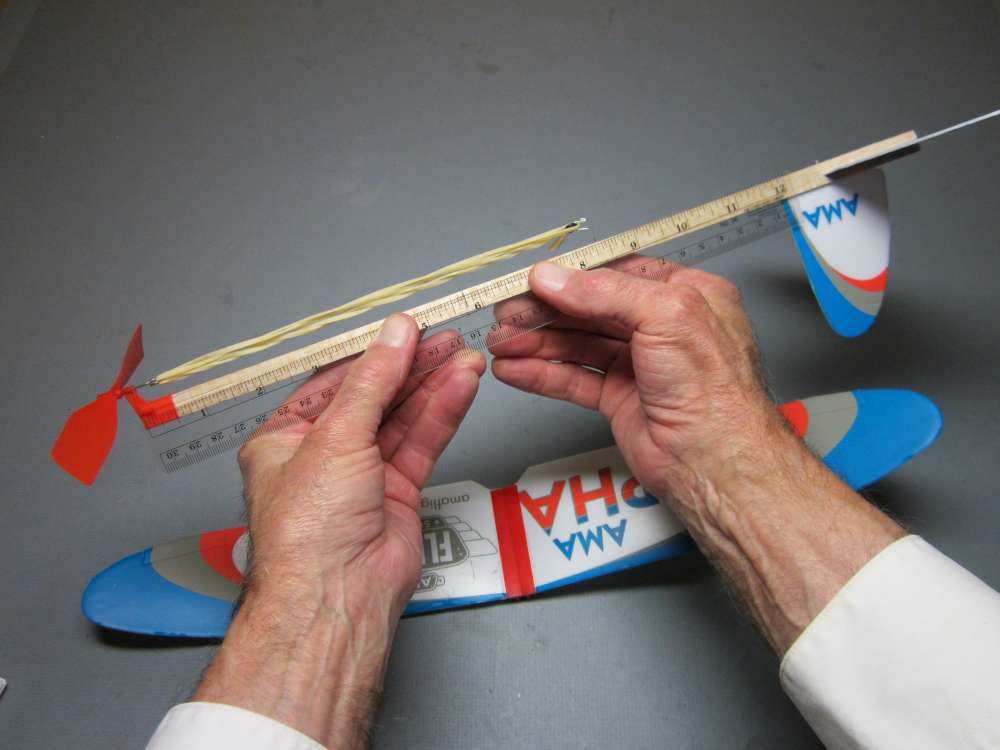
Measure the distance from the nose to this mark. Here it is 5 3/4″.
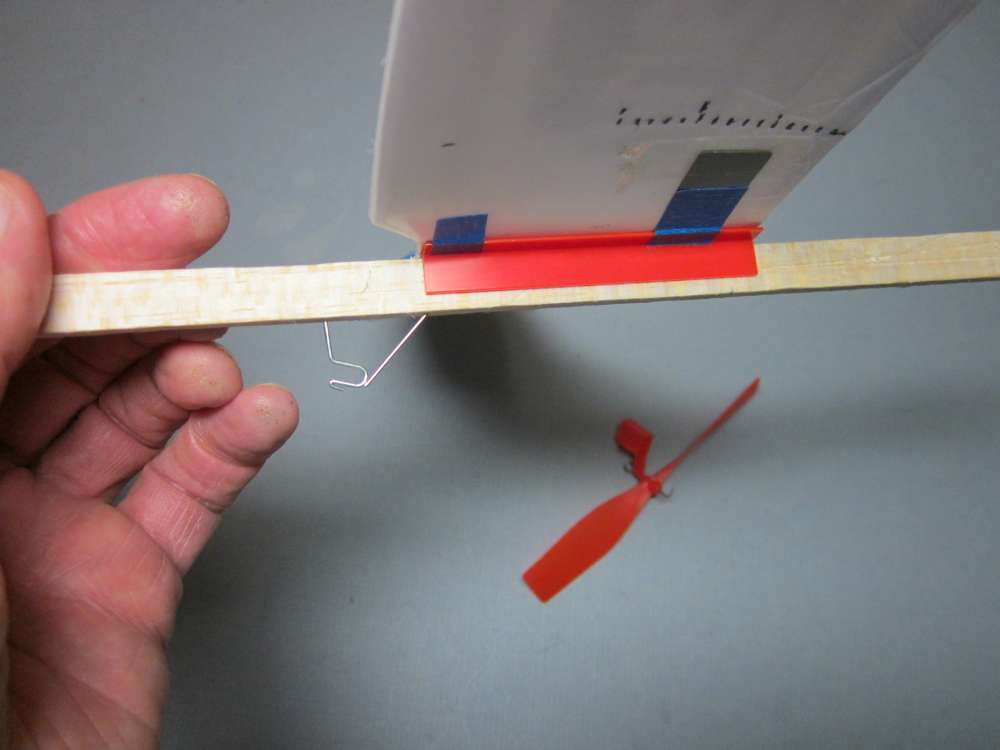
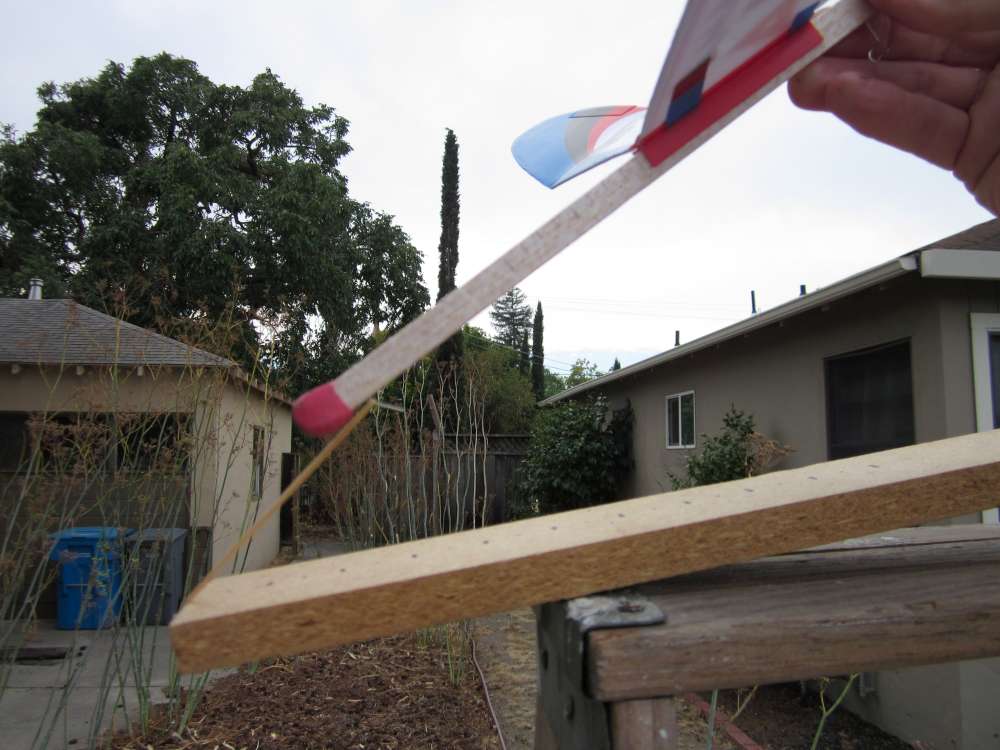
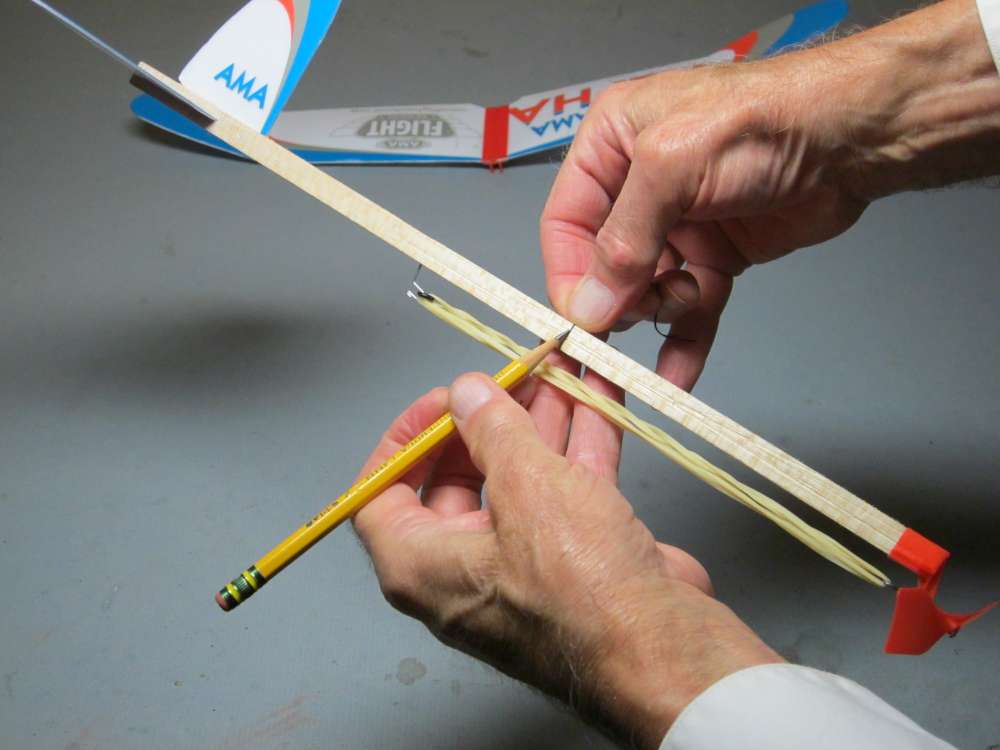
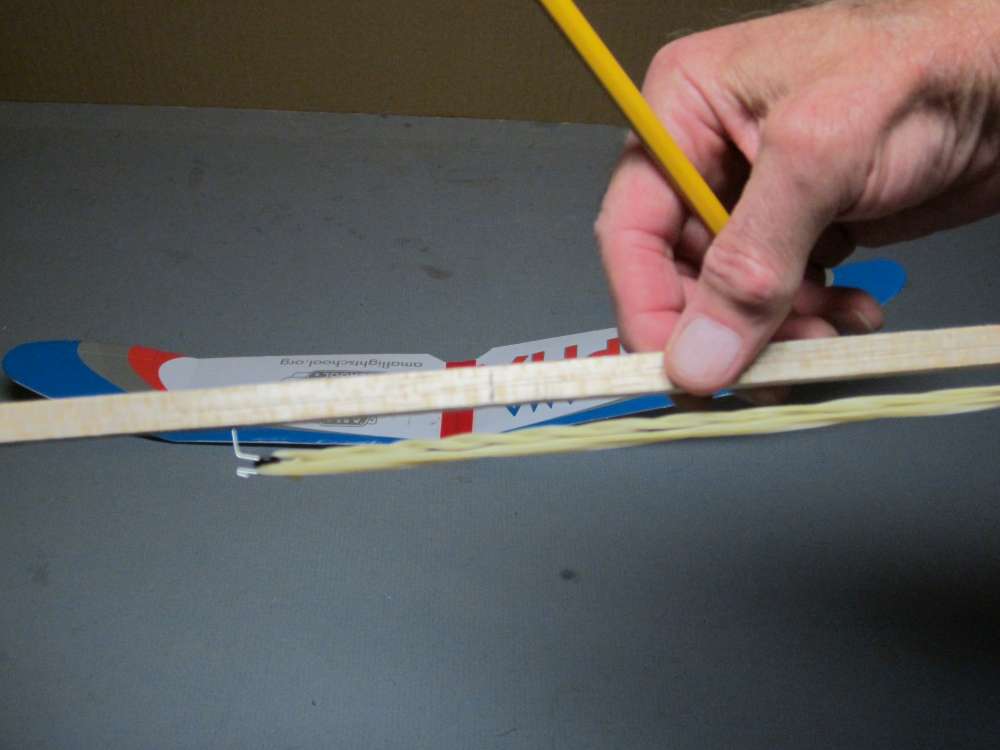
We will balance the wing assembly upside down on the point of a pencil. First we will make a little scale.
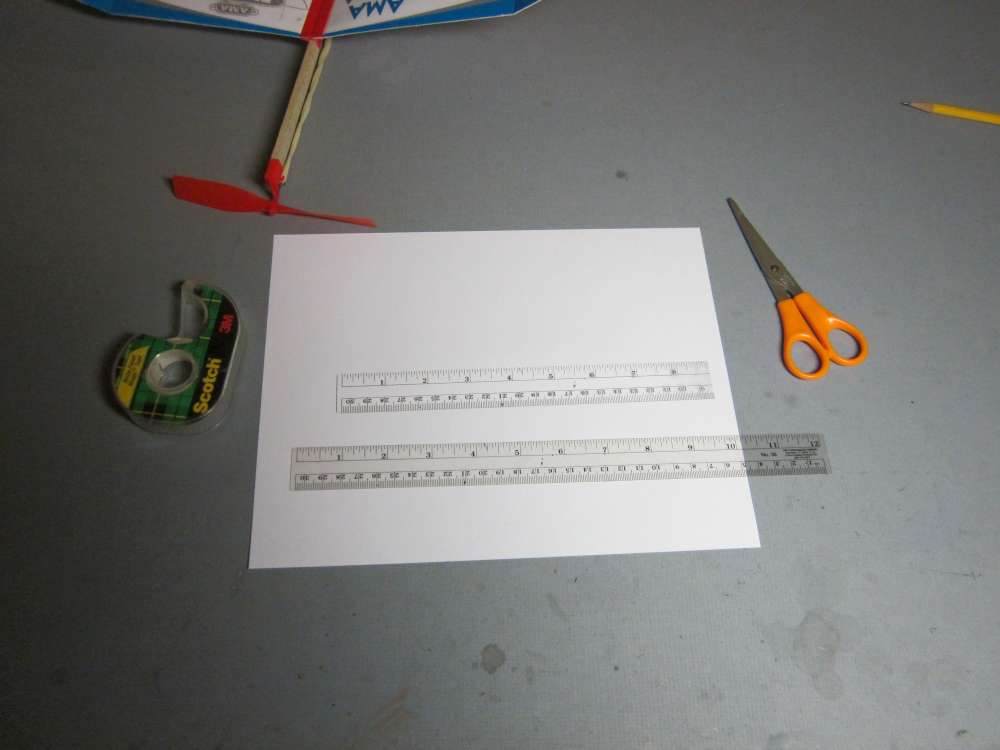
Make a copy of a ruler.
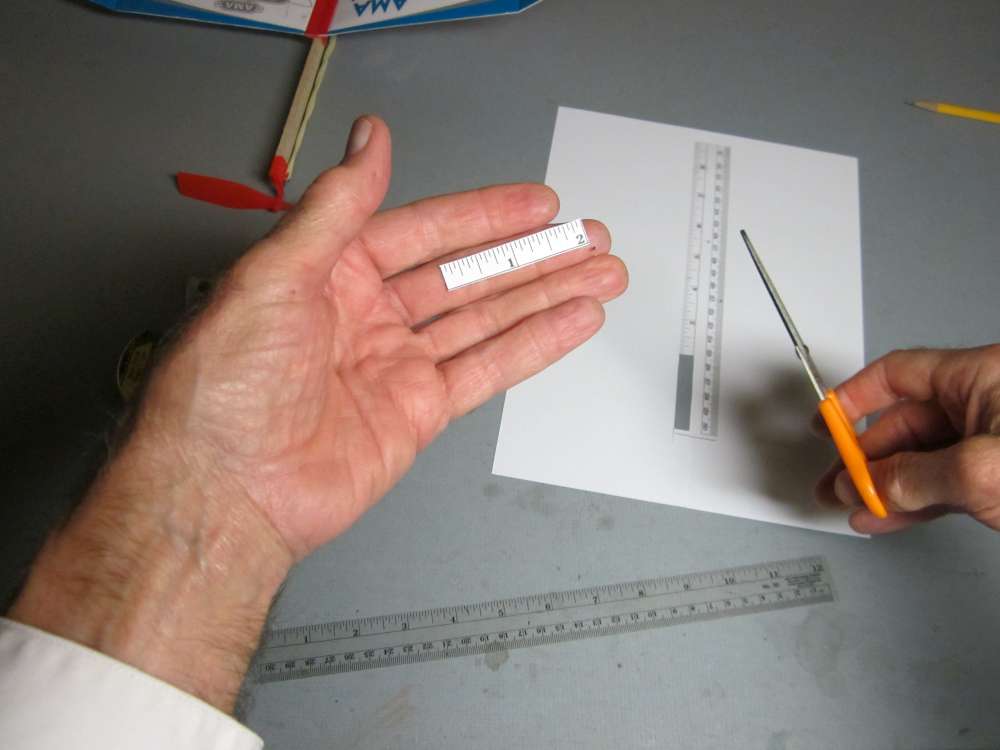
Cut out a couple inches, starting at the zero line.
Center the strip face down on the edge of the stick.
Press it over the edge to crease it so it will lie flat on top of the wing clip.
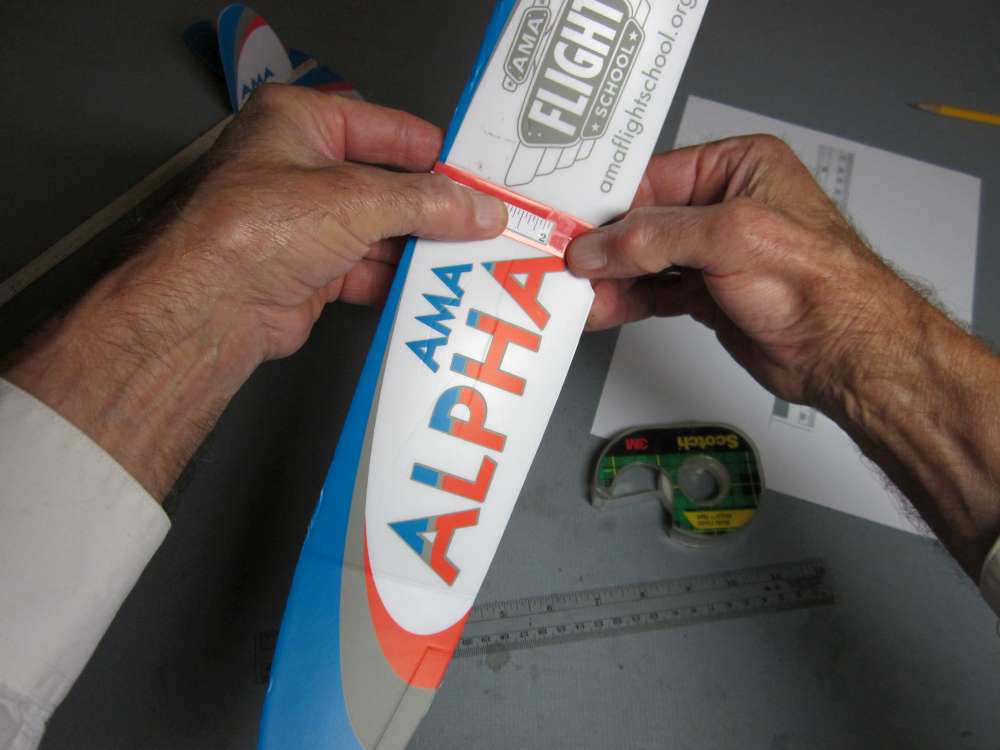
Tape it to the top of the wing clip so the zero line on the ruler aligns with the leading edge of the wing.
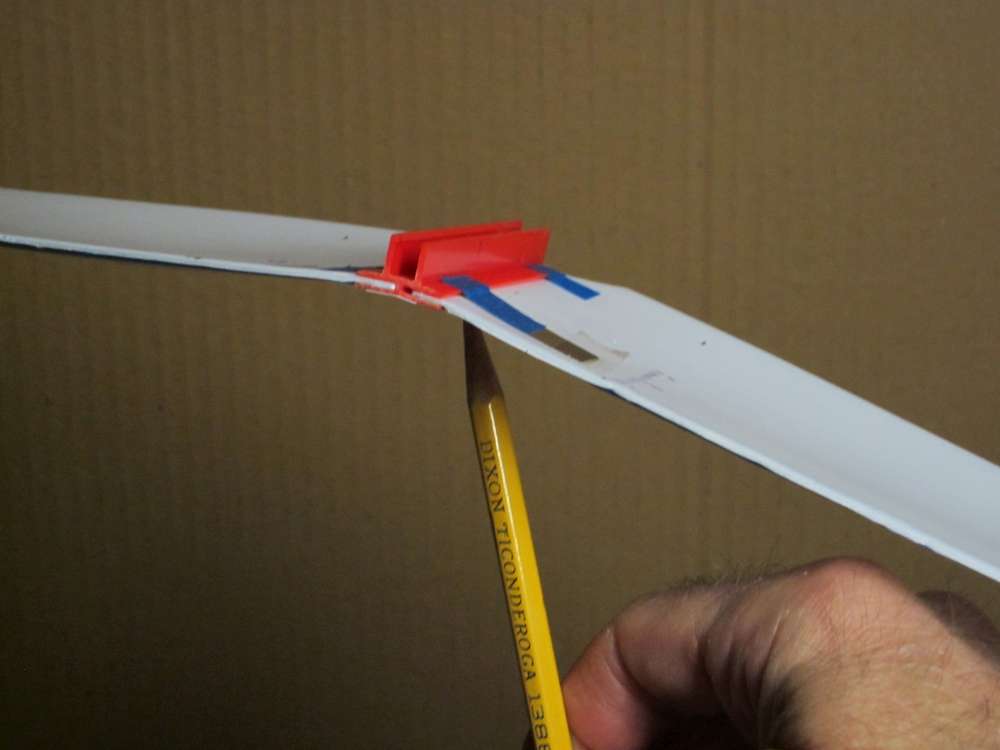
Balance it on the pencil point so the wing clip is horizontal. The wing balances 1 1/4″ back from the leading edge.
We now have all the information we need to calculate the wing position we want.
This is a simple weight and balance calculation. There are several equivalent ways to set this up. Intuitively, we are balancing forces rotating the plane around the nose. The lift, which is equal to the total weight, is rotating the airplane up, and the weights of the wing and fuselage are rotating it down. We want to locate the wing so the up moment is equal to the sum of the down moments. The moment of a force around an axis is the product of the force times its distance from the axis.
The moment of the fuselage assembly about the nose is 8.5 grams times 5.75″, 48.75 gram inches.
The moments of the wing depend on its distance from the nose, which is the unknown we are looking for. We will call it w.
The distance of the wing CG from the nose is w plus the distance of the wing CG from the leading edge of the wing, which is 1.25″. The moment of the wing is therefore 8.6 grams times w + 1.25″.
The distance of the wing lift is w plus the 1.1″ distance of the lift from the wing leading edge. That is the CG position which gave us the slowest descending glide. (I judged the minimum sink CG position on the wing to be a little further aft than the 1.09″ of our test table because the smooth curve suggests the minimum sink position is a little closer to the 1.19″ position corresponding to the 5″ wing position.)
Our equation says the sum of the fuselage moment and the wing mass moment equals the lift moment:
8.5 x 5.75 + 8.6 x (w+1.25) = 17.1 x (w+1.1)
48.875 + 8.6 x w + 10.75 = 17.1 x w + 18.81
40.815 = 8.5 x w
40.815/8.5 = 4.80 = w
Thus we should put the leading edge of our wing 4.8 inches from the nose end of the stick. This is about 4 13/16″.
Put a mark 4 13/16″ (4.8125″, close enough) from the nose.
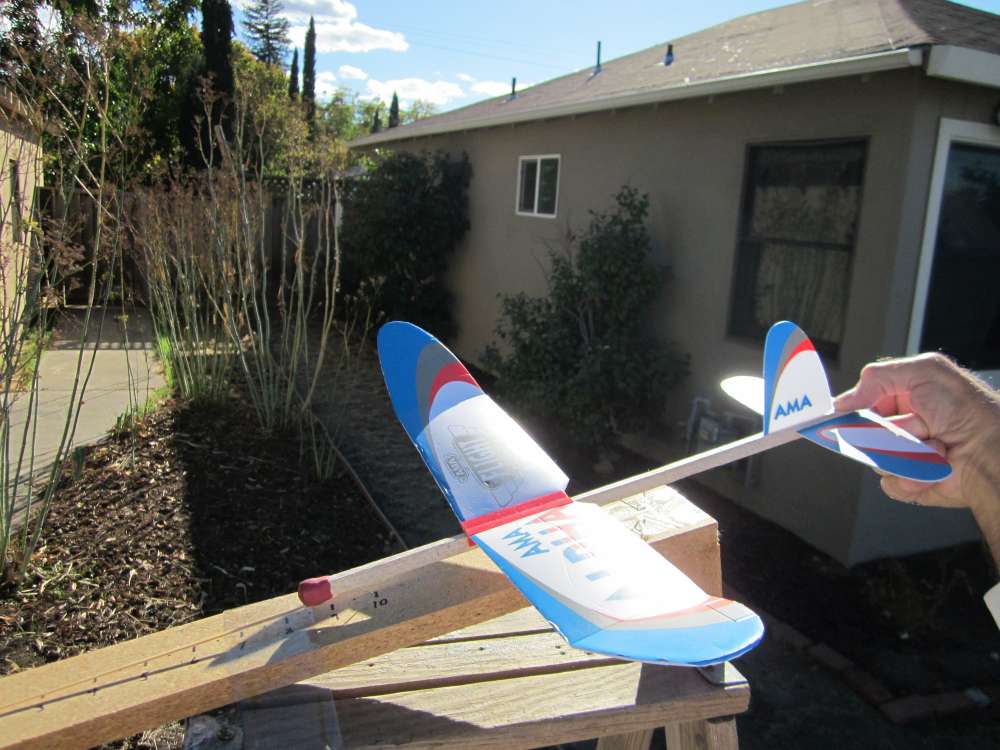
Press the wing clip onto the stick, aligning the leading edge with the mark.
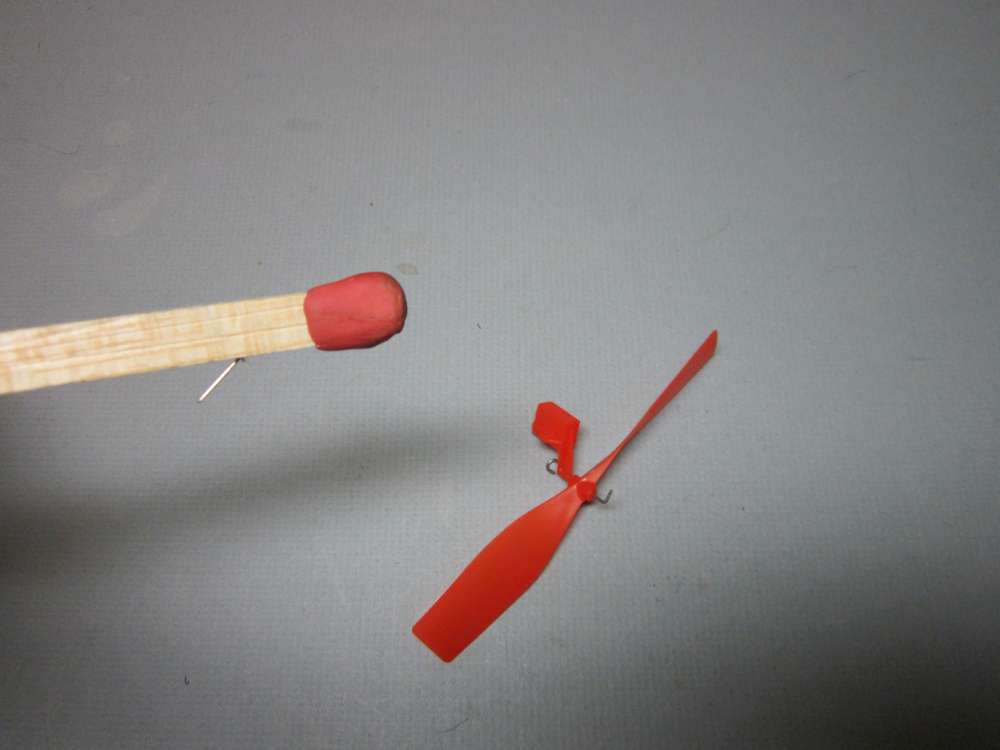
Press the propeller assembly in place.
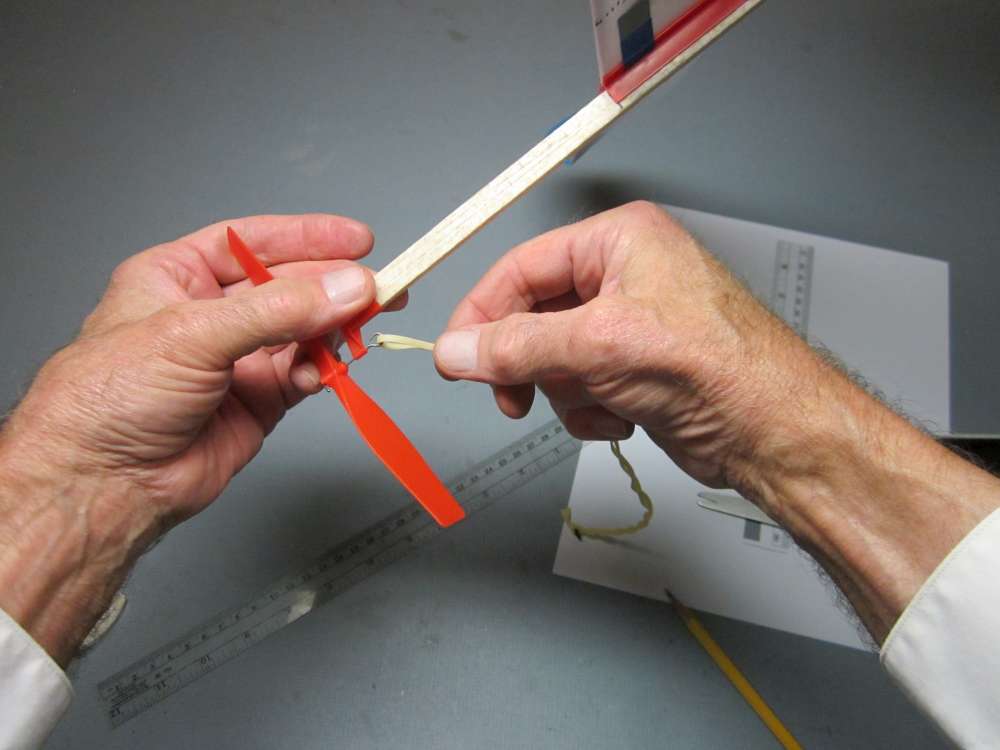
Put the unknotted end of the motor into the hook of the prop shaft.
Put the knotted end of the motor onto the rear motor hook. In this case I have used a 1/8″ O-ring to make it easier to get the motor on the hook when it is fully wound.
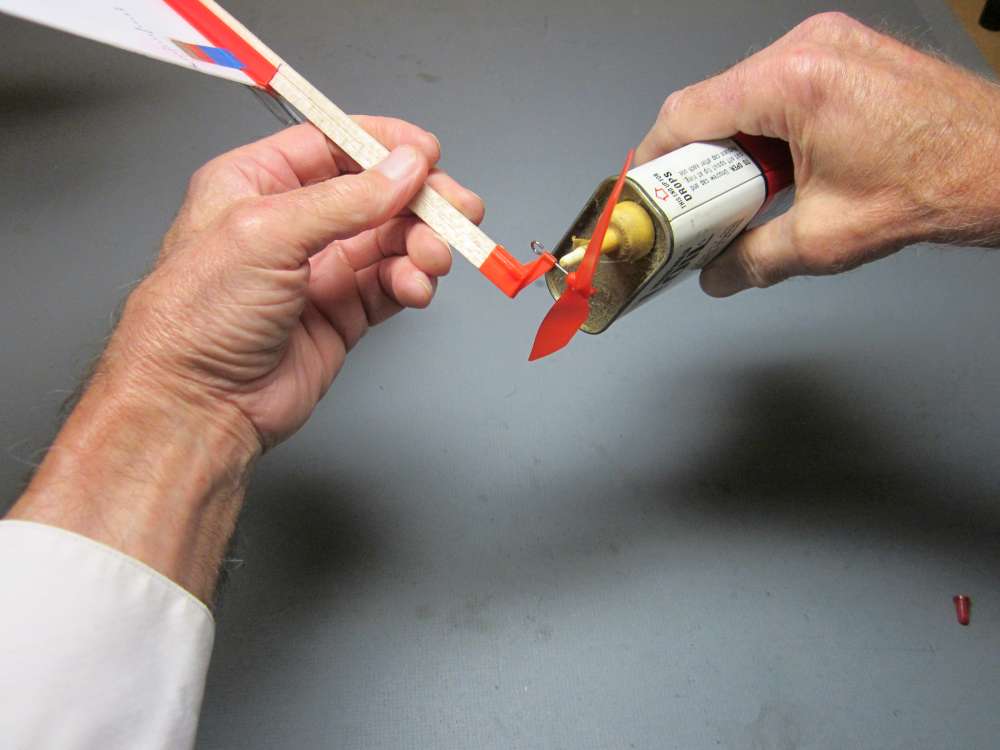
Lightly oil the shaft and bearing. Blot off any excess. A thin coating is all that is necessary.
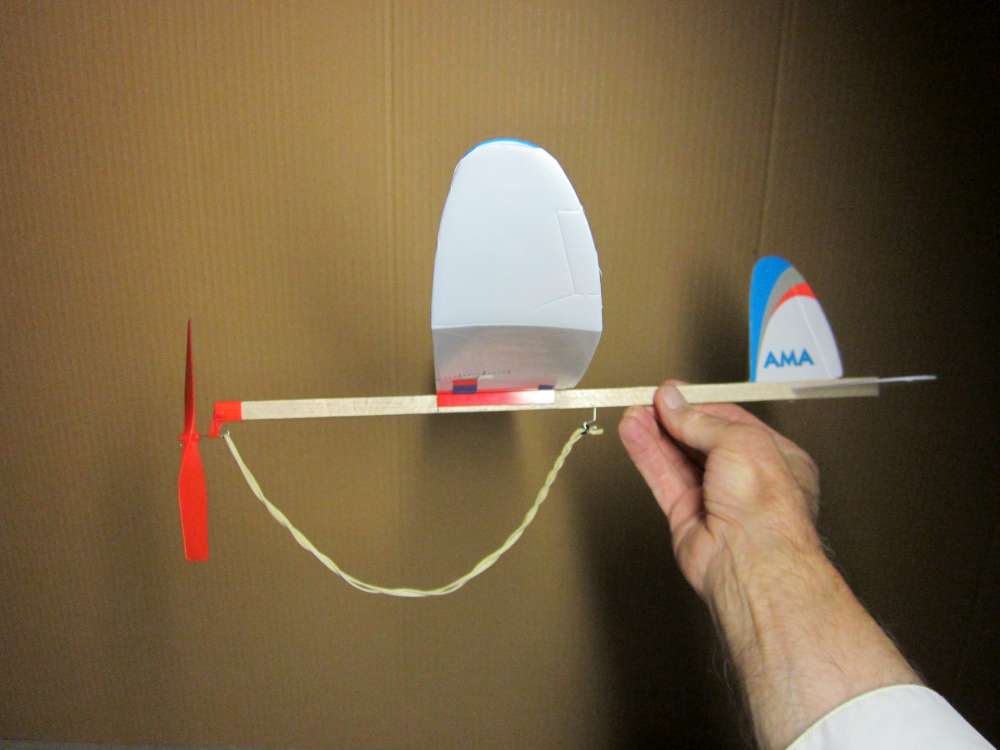
We are ready to go flying!
The best wing position for powered flight may not be exactly the same as for gliding flight. The propeller thrust puts things a little out of balance and the propeller slipstream changes the forces on the wing and tail. We will do powered flight tests to fine tune the wing position for longest flight. The wing position for slowest sink is a good place to start powered flight tests.
One thought on “Glide Testing”