Aerodynamic Data
The aerodynamic properties of airfoils are measured in wind tunnels. Lift coefficient, drag coefficient and moment coefficient are measured over a range of attack angles. Lift to drag ratio and power factor are calculated at each angle. The data may be presented in tables or in graphs.
The values of these coefficients vary with aerodynamic scale. There are several aerodynamic regimes with different phenomena, such as viscosity, inertia, turbulence or compressability, predominating in each. Aerodynamic scale of airfoils is dependent on the wing chord and the air speed. Aerodynamic scale is quantified as the Reynolds Number. For our purposes, Reynolds Number is the product of wing chord, in feet, times the airspeed, in feet per second, times 6,369. The 6,369 assumes certain values of air density and viscosity that are taken as standard.
The Cloud Tramp, with a wing chord of 3″ and a flight speed of around 10 feet per second, has a Reynolds Number of about 16,000. This is typical of our small airplanes. There is a vast quantity of aerodynamic data published, but most of it is for full scale aircraft with Reynolds Numbers in the millions.
Aerodynamic properties also depend on the shape of the airfoil cross section. Our airfoils are usually thin arcs or flat plates. Most full scale aircraft have thick airfoil sections.
There is very little wind tunnel data to guide us in the selection and use of airfoils for our little models.
Over the years I have gathered what I could find. This table contains the results of that collecting. You can copy, save and print the picture, or double click to enlarge.
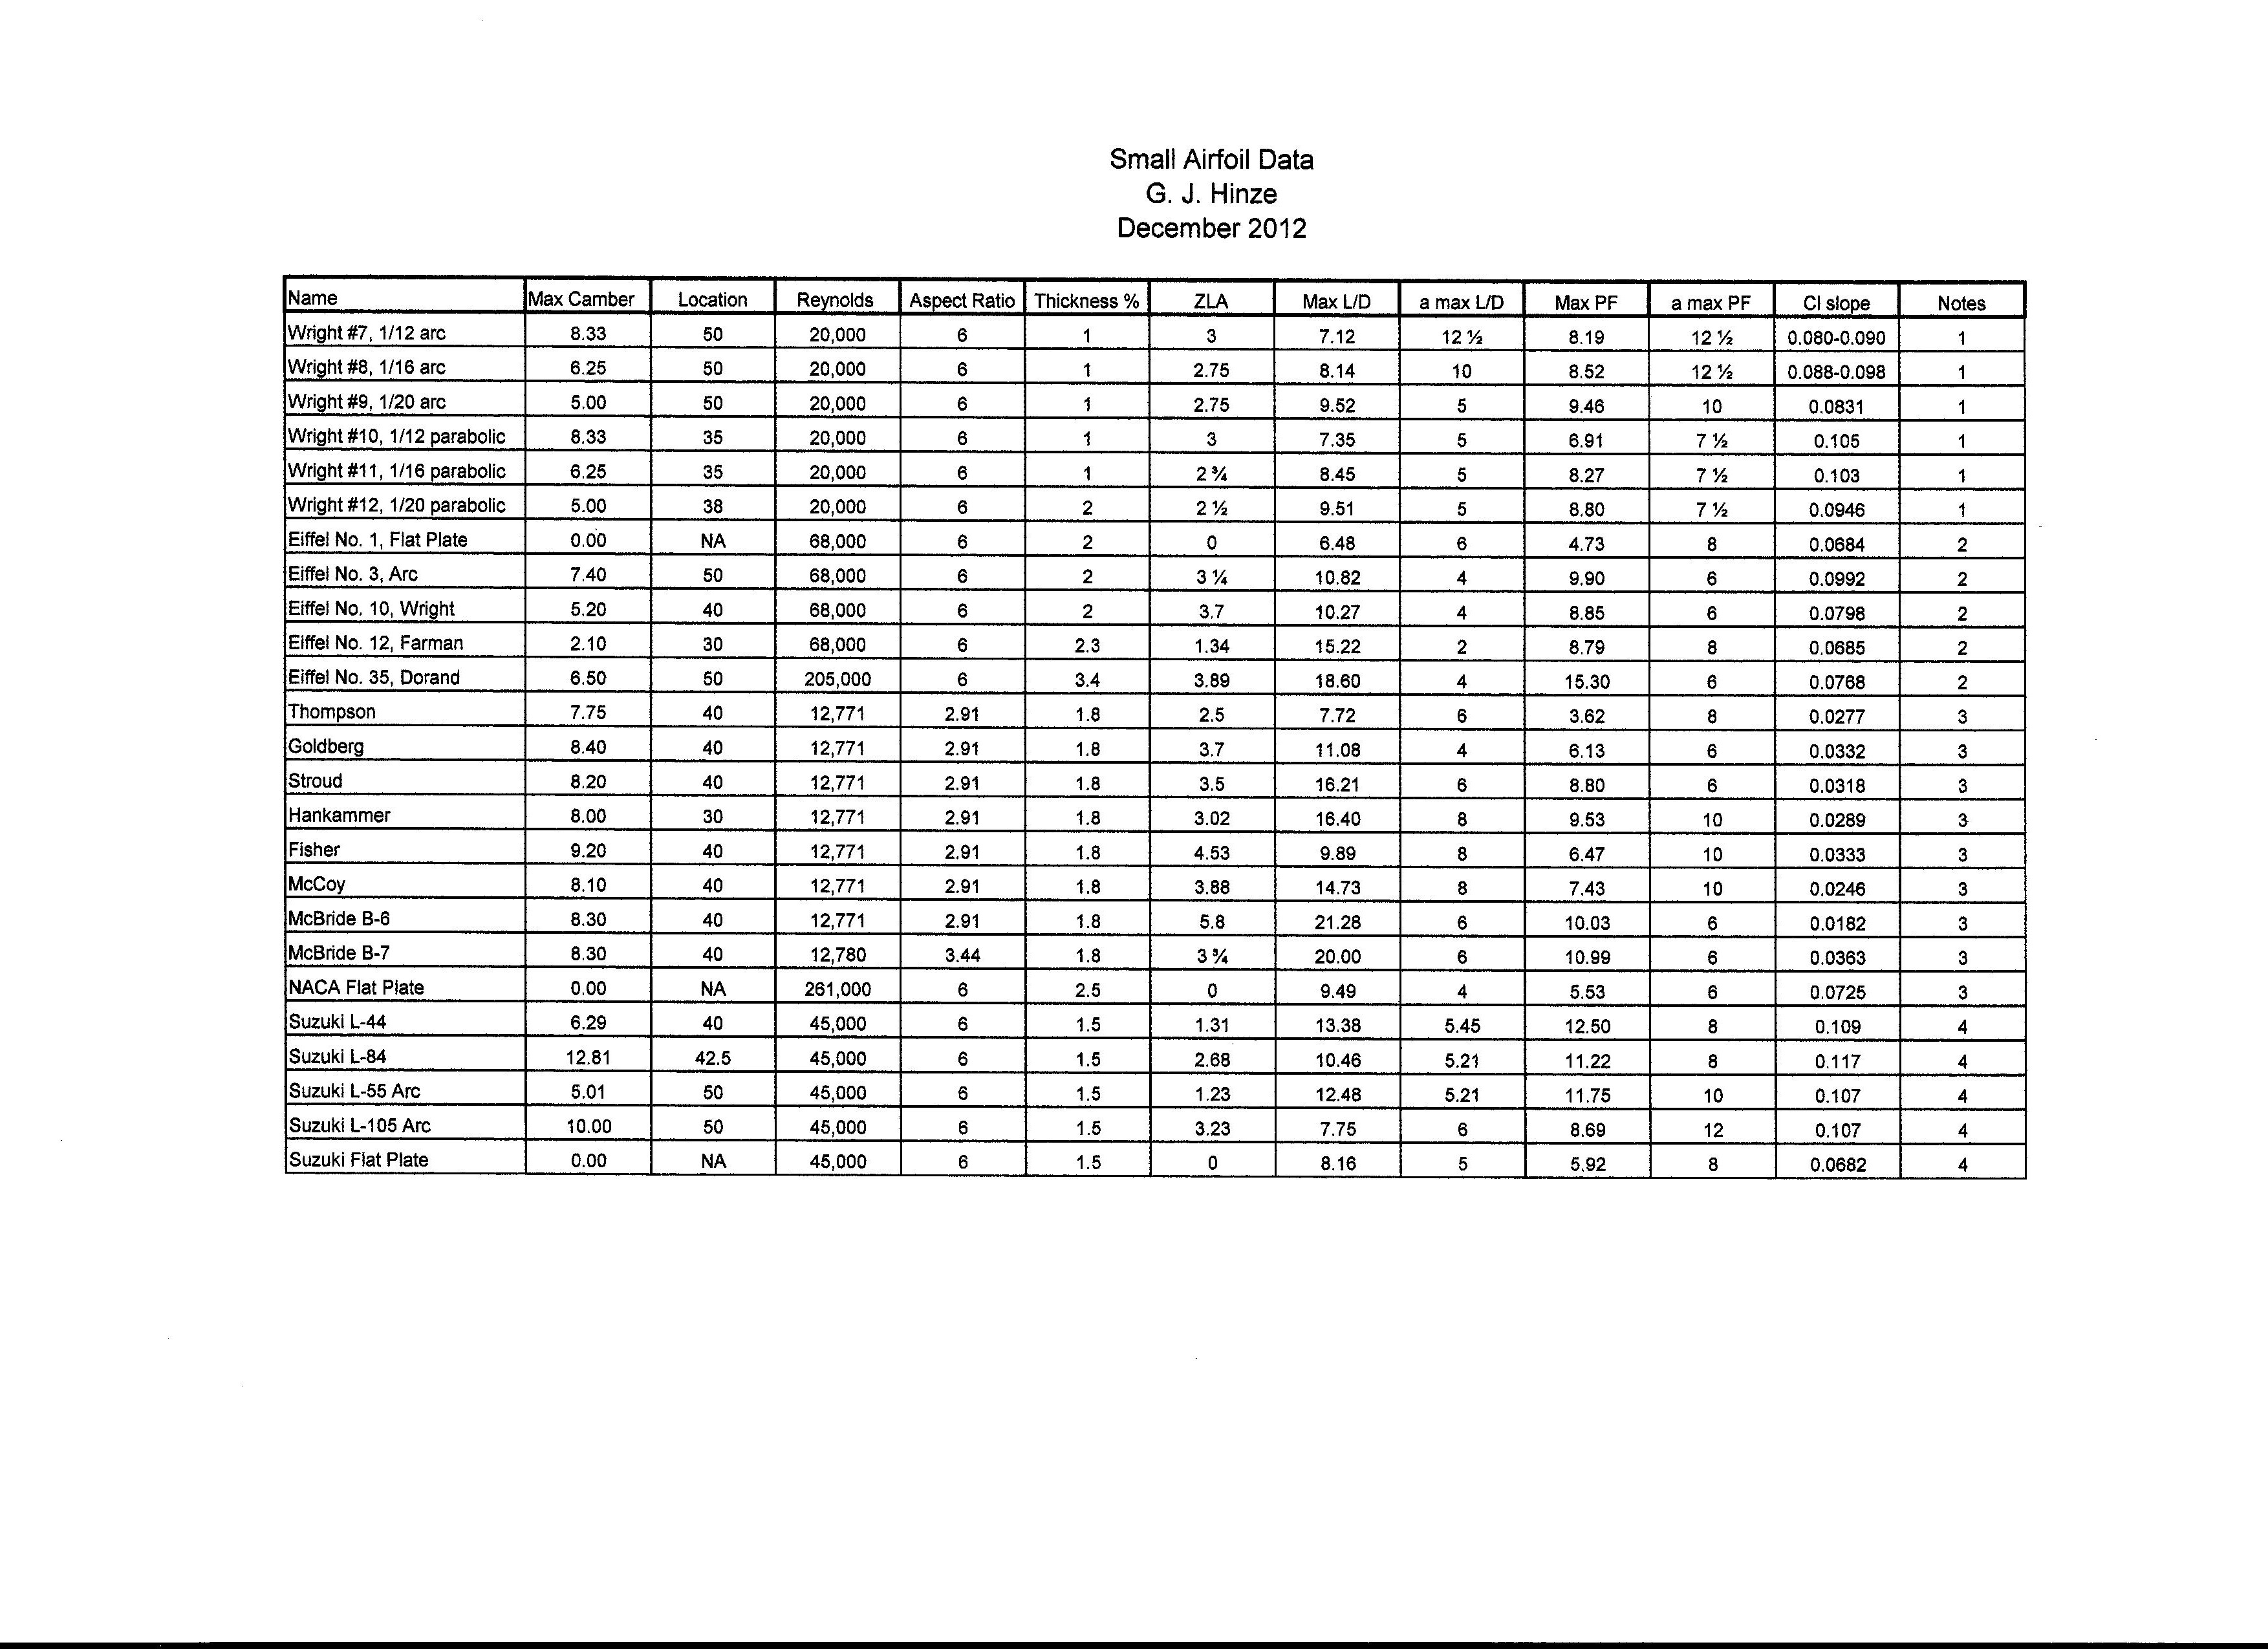
You can click on this link Small Airfoil Data to download the original Open Office file.
Nomenclature
Max Camber – the maximum separation between the chord line and the mean thickness curve, the height of the highest point on the arc, expressed as a percent of the chord.
Location – the location of the maximum camber point along the chord, expressed as a percent of the chord.
Reynolds – The Reynolds Number, estimated as the product of the wing chord in feet, times the airspeed in feet per second times 6,369.
Aspect Ratio – The ratio of the wing span to its average chord. Aspect ratio has a strong effect on aerodynamic properties of wings.
Thickness – The maximum thickness of the airfoil expressed as a percent of the chord.
ZLA – Zero Lift Angle. This is the angle of the chord to the oncoming air stream that corresponds to zero lift. For positively cambered airfoils, the wing will be tipped down in front several degrees to produce zero lift. This corresponds to a negative attack angle.
Max L/D – the maximum lift to drag ratio. (This is not a measure of efficiency, as it usually has a value much greater than 1.)
a max L/D – the attack angle at which the maximum L/D occurs.
Max PF – the maximum value of the Power Factor, sometimes called the Sink Factor. It is the square root of the ratio of the cube of the lift coefficient to the square of the drag coefficient. It determines the minimum power required to fly and the minimum sinking speed without power. Lift and drag coefficients are for foot-pound-second units.
a max PF – the attack angle at which the maximum PF occurs. This is usually a couple degrees higher than the attack angle at which the maximum L/D occurs.
Cl slope – is the slope of the lift coefficient with respect to the attack angle. It tells you how rapidly the lift coefficient increases with increasing attack angle.
Notes
The measurements were made at different times and places using different kinds of equipment and measuring processes. Definitions of terms and units varied from one to another. Each set required conversion from the source format into a standard format. Some were recorded in numerical form, while others were in graphical form and required measurement and conversion. Most measured in steps of a few degrees, so maximum values could be off by a bit if they occurred between angles at which measurements were made. See the notes for each source for specifics. Most of this data has no direct applicability to our models. At best it can be a general guide. Keep in mind that this data is for the wing models tested. Application to a complete aircraft requires consideration of the aerodynamic effects of parts of the aircraft other than just the wings.
Sources.
1 – Marvin W. McFarland (ed.), The Papers of Wilbur and Orville Wright, Volume One 1899-1905, McGraw-Hill Book Company, 1953.
The wind tunnel data is contained in Appendix II. Wright Wind Tunnel, 1901, Section E. Wind Tunnel Tables. The Wrights used a very unusual set of balances to make their measurements. Their 1″ x 6″ sheet steel wing models were placed in a 16″ x 16″ box through which air was drawn by a fan. The models lift was balanced against the drag of a standard area placed perpendicular to the stream. The attack angle was increased in steps of 2 1/2 degrees. The lift force was estimated by comparison with the force calculated for the perpendicular plate from Smeaton’s coefficient. The value they used was not in accordance with modern measurements, easy enough to redo. Drag was not measured directly, instead the angle of the resultant to the air stream was measured with a separate balance, effectively measuring the tangent angle of the lift to drag ratio, so the drag coefficient was calculated trigonometrically. The air speed for individual tests is not known, so the Reynolds Number was calculated from the speed mentioned in their description of the tunnel.
2 – G. Eiffel, Nouvelles Recherches sur la Resistance de L’Air et L’Aviation Faites au Laboratoire D’Auteuil, H. Dunod et E. Pinat, 1914.
The models were tested in an open throat jet. Attack angles were in steps of 2 or 3 degrees. Measurements were made at various speeds. Measurements were in kilogrom-meter-second units, converted here. The data was presented in both numerical tables and graphs. The Wright airfoil is that of Howard Wright.
3 – J. Wallace McBride, “Some Technical Notes on the Present Indoor Airfoil”, published in Frank Zaic, 1934 Junior Aeronautics Year Book, Junior Aeronautical Supplies, 1934, pages 25-31.
McBride tested his airfoils in an open jet. The results are presented in 1 1/4″ x 2 1/4″ graphs, from which the data must be scaled. The Flat Plate is from NACA Annual Report 10, Elliot G. Reid, “The Effects of Shielding the Tips of Airfoils”, LMAL, 1925, NACA Report No. 201.
4 – S., Suzuki, “Whirling Arm Airfoil Testing”, published in Frank Zaic, 1955-56 Model Aeronautic Year Book, Model Aeronautic Publications, 1956, pages 42-47.
The data is presented as small graphs.