By Gary Hinze.
This examination of the role of skill, chance and scoring method on the outcomes of model aviation competitions is based on the 2012 F1D World Championships. The methods displayed may be applied to other competitions.
F1D is the ultimate class of indoor model airplane. The rules specify a maximum span of 550 mm (21.65″), minimum airframe weight of 1.2 grams and maximum rubber motor weight of 0.6 gram, among other things. The score is the sum of the top two flights out of six flights. The F1D World Championships are the highest level of indoor model aviation competition. The competition rules are established by the FAI, Sporting Code, Section 4, Aeromodelling, Volume F1, Free Flight Model Airplanes.
The 2012 F1D World Championships are documented at the National Free Flight Society web site with history, photos, videos and knowledgeable reporting.
The Final Results are also reported at the Serbian Aeronautical Union site, F1D page, who hosted the 2012 competition.
Serbian Aeronautical Union Site F1D Page
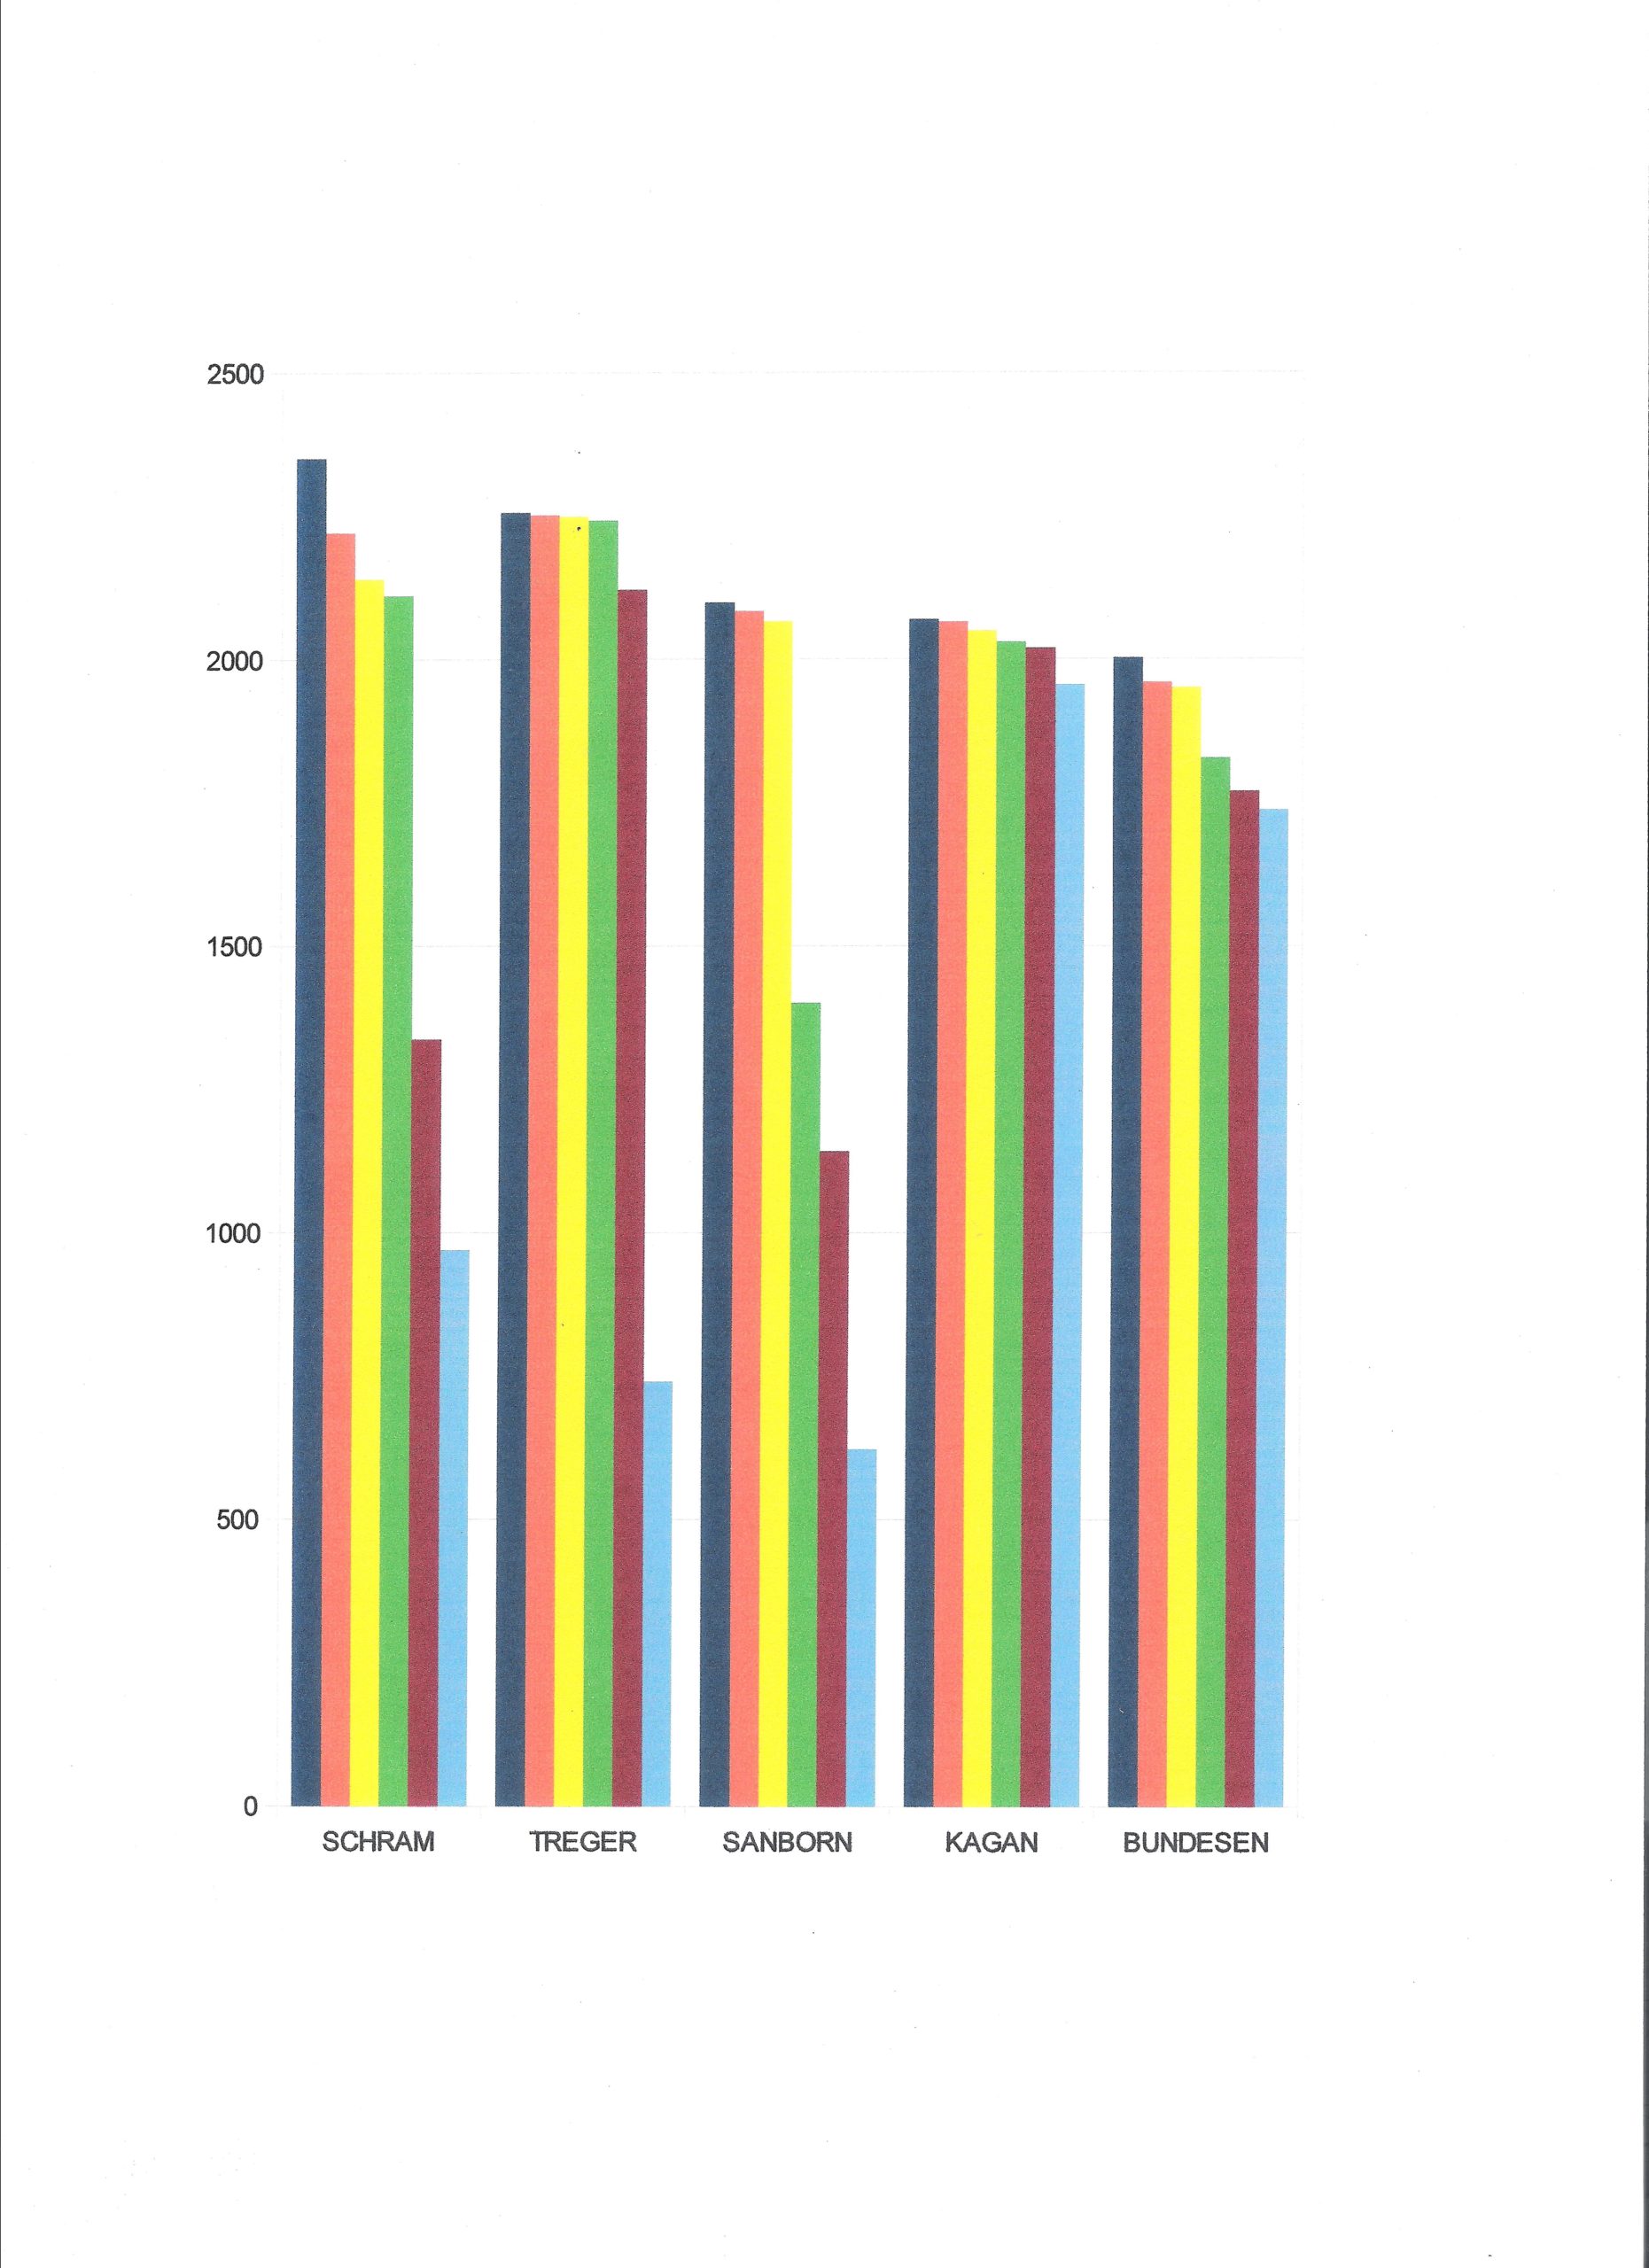
The bar chart at the top of this page shows the six individual flight times of the five competitors in the top four positions in each column of Table 3.
I was initially interested in examining the final scores to test my thesis that:
At the highest level of competition, the outcome is determined almost entirely by chance.
This is a truism among sports handicappers, yet it is highly disputed among competitive aeromodellers. It is based on the observation that, at the very highest level of any competition, the competitors are the very best and about equal in strength, so the outcome is about equal to flipping a coin. I have found this to be true in the NFL playoffs (77% chance) and in the Wakefield F1B outdoor aeromodelling competition (95-99% chance). My examination of the 2012 F1D World Championship scores found some surprises. I discovered that the scoring method makes a very big difference in the ranking and that rank may not be consistent with what you might expect from comparison of flight times. I also found very clear separations among the top five competitors, suggesting that chance does not play as large a role in F1D as in F1B, although it can where two competitors are closely matched. This may be due to the fact that outdoor weather introduces a larger spread in the F1B scores, increasing the role of chance in the outcomes of similar competitors. It may be due to the turnover in the F1D competitor population, with more relatively new competitors in the top ranks. This suggests issues that merit further study. We have been told that indoor thermals played a role in this year’s F1D competition. It would be interesting to compare the role of skill and chance in venues where thermals were not a factor. It might be interesting to examine F1D scores of the past, before the Science Olympiad program brought a group of newer competitors into the activity,when there may have been a more stable pool of more mature competitors.
I started by converting all flight times to seconds, for easier comparison and statistical computation. (Table 1) I looked only at the top 22 competitors, excluding those who had no time over 30 minutes. That number would be more than enough to test my thesis, since I am concerned with only the very top ranks. Note that the competitors are ranked in order of their final scores. The final score is the sum of the two highest flight times out of six that may be flown. I also calculated the average and standard deviation of each competitors six flights. If we look at the average times, we see that the highest average is surprisingly far down in the ranks. If the score was the average of all six flights, the ranking would be very different. The average is the total of all six flight times, divided by six. The ranking of the averages is the same as the ranking of the total of all six. Standard deviation is the measure of the dispersion of scores around the average. It is a measure of the consistency of scores. Note that John Kagan’s SD is 1.89% of his average, compared to a typical 35%. He is a very consistent performer. This is remarkable, because it is difficult to cut rubber with that reliability; the variability in the thickness of rubber strip makes it difficult to cut rubber motors to weight or cross section with SD better than about 1%. That is only one of several random variables that may affect the outcome.

I made another table, showing the scores that would result from counting the highest time, the sum of the two highest, three highest, and so on to the total of all six. (Table 2) I have put the corresponding rank of each competitor next to the competitors score. You can see how much difference the method of scoring makes. There are many significant shifts in rank, going from highest single time to sum of six. Kaplanova and Chanpion move from 21 and 22 to 7 and 8. Schram goes from 1 to 4 and Kagan goes from 4 to 1.
There are several other scoring systems, such as casting out the highest and lowest times and summing the remaining times, which I do not consider here.

Let’s take a closer look at the two extreme scoring methods; the single highest flight and the sum of all six. (Table 3) There are five flyers in the top four in each. The results are significantly different. This leads to the question “Who is really the best man?”* Isn’t that what we expect from a competition? We say “May the best man win!” What do we mean by “the best man”, then, if two obvious ways of scoring can produce such different results?

The single best flight can be regarded as giving too much credit to luck. At the same time, luck works for everybody and the winner presumably was the best prepared to take advantage of anything luck offered. The winner won because he pushed his luck, by taking chances, pushing everything to the limit. He did in fact make that lucky best flight. The highest sum of six rewards consistency. It emphasizes good practices, but not pushing the limit. What do we expect from a scoring method? Is there a more reasonable scoring method that is more consistent with what we mean by “the best man”? Do we need to think more about what we mean by “the best man”?
Let’s go back to basics. The simplest competition is when two flyers each make a single timed flight. We compare the times. The competitor with the longest time is obviously the winner. How can we apply this simple logic when each flyer has six timed flights? We can compare each contestant’s six flights with each of the other contestant’s six flights in a table, showing 6 x 6 = 36 comparisons for each pairing. (Table 4) We can record and count the wins of each contestant in each one-on-one comparison. We can consider the contestant with the most wins to be the overall winner. This method of making flight to flight comparisons shows that Treger wins 23 of his 36 matches with Schram (63.9%), and Schram wins 13 (36.1%). This same tally can be done in a columnar format in which both competitor’s times are ranked in a single column and the number of wins that time would get are recorded. (Table 5)
Let’s look at what this tells us about the interplay of chance and skill. Treger won 10 more of the matches than Schram. We may take this as the measure of the difference in skill or merit. If they were identical in skill, we would expect them to each win half of the matches. The remainder are split by chance evenly, half to Treger, half to Schram. We find that Treger won 10/36 = 27.78% by skill. He won 13 by chance and lost 13 by chance, for a total of 26/36 = 72.22% determined by chance. Note that this allocation does not apply to any individual pairing, but to the overall statistic.
This would seem to imply that Treger was the better competitor. But Schram won the contest.
Let’s make similar comparisons among the top five competitors who appear in the top four ranks in both scoring systems. A five sided matrix would be difficult to manage, but the tabular format shows clearly what we want.Each row shows the score that won all the pairings below it. (Table 6)

I have tallied the wins of each competitor against each other competitor and calculated the distribution of skill and chance. It is interesting to note that where competitors are close in skill, chance has a greater role in the outcomes, as expected. Where there is a marked difference in skill, skill dominates, also expected.
We can now tally each competitor’s win/loss ratio against the entire field. For example, Treger won 23 against Schram, 30 against Kagan, 30 against Bundesen and 31 against Sanborn, for a total of 114 wins in his 144 matches, or 79.17% of his matches. (Table 8) This ranks them: Treger, Schram, Kagan, Sanborn then Bundesen. Note that this is a different ranking than either of the previous two. (Table 3)

But something does not feel quite right. Look at the bar chart at the top of this page and try to decide who is the best competitor. Going back to the comparisons (Table 6) and looking specifically at Bundesen vs. Sanborn, it is true that each won an equal number of matches, but Bundesen had a much higher average score, and his wins were by a much greater point spread. (Table 9) Shouldn’t we consider point spread as an important measure of merit? Not all wins are of equal value. A win should not be counted simply as a win, a weight should be assigned. What if we tally the point spreads in each match? We find that Bundesen won 14,754 seconds from Sanborn and Sanborns wins totaled 3,758 seconds. The difference of 10,998 seconds is a plausible measure of relative merit. However, the average point spread per match is 305.5 seconds, exactly equal to the difference in their average flight times. This results in exactly the same ranking as the average score! A similar comparison of Treger and Schram makes the same point. It is no surprise that average flight time is a good statistical measure of overall merit.
With only six flights for each, we can’t get a very clear delineation of the statistical distributions. This difficulty might be overcome if we had many more timed flights for each competitor. Unfortunately, a statistically representative sample is not going to be available. Even if we could gather many more flight times from previous competitions, they would not represent the same event or competitor. Venus differ. Contestants learn and improve over time. There is no practical way we can get around the limitations of a small sample.
I am not suggesting that any completed contest be rescored. I am presenting this analysis for discussion by the aeromodelling community. This discussion can produce a more enlightened understanding of the role of scoring rules in competition. A contest organizer can make any rules he likes. Every competitor is operating under the same rules and can decide whether or not to participate. In the larger sense, it is the aeromodelling community which decides on the rules, specifically those who participate in any given event. Every rule making body has procedures for changing the rules and takes input from competitors.
The outcome of a competition is shaped by the merit of the competitor, elements of chance, who else shows up at the event and the scoring method. All of these contribute to who we salute as “the best man.” The scoring method is a matter of choice. Each measures different things. I prefer the single highest time. That reflects the merit and daring of the competitor and his ability to make the best of what fortune gives him. Looking at the bar graph suggests that the major impact of chance in this event is to detract from good times, not to add wide lucky winning margins. The deviations are not symmetrical. Something went seriously wrong to take a top competitor’s time below 1,500. My preference reflects my background in track, where the single highest jump or shortest time won. Maybe each competitor should get one flight. What do you think?
*I know two of the 2012 F1D competitors were female, including the Junior Champion. My gender usage here is consistent with San Jose Municipal Code Section 1.04.030 which says “The masculine gender includes the feminine and neuter.”